
 On April 17, 2014, the Centers for Disease Control and Prevention (CDC) published its annual report: Incidence and Trends of Infections with Pathogens Transmitted Commonly Through Food – Foodborne Diseases Active Surveillance Network, 10 U.S. Sites, 2006-2013 (http://bit.ly/041814report).
CDC publishes this report to summarize data generated by the FoodNet surveillance program. FoodNet, established in 1996, monitors reported foodborne illnesses in 10 states. From this data, CDC tracks illness trends for major pathogens and provides estimates on foodborne illnesses in the United States. More information on FoodNet is available on the CDC Web site (http://www.cdc.gov/foodnet/).
The report card: the pathogens
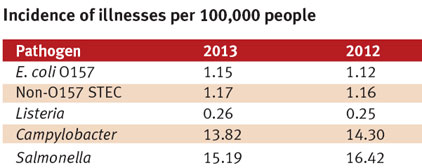
The 2013 Report Card was disappointing. Not only are the incidence levels well above the Healthy People 2020 incident targets, there was no progress in the past year for four of the five top pathogens. The only improvement was for Salmonella, which declined in 2013 as compared to the 2010-2012 baseline. However, when measured against the 2006-2008 Salmonellabaseline, there was no statistically significant improvement. Moreover, Salmonella caused the most illnesses (38%) in 2013 (Campylobacter was a close second at 35%).
For persons who get ill from food, the incidence remains highest amongst children younger than 5 years old and adults over 65 years old. That said, the number of reported cases of hemolytic uremic syndrome (HUS) in children under 18 years in 2012 (the 2013 data is not yet available) declined 36% when compared to the 2006-2008 baseline.
Pathogen serotypes
E. coli O157:H7— The incidence rate for this organism increased again, though the 2013 rate was not significantly different than the rate for the 2010-2012 baseline. At 1.15 cases per 100,000 population, it does not meet the 2010 Healthy People target of 1.0 cases, nor the 2020 target of 0.6 cases. If the incidence rate continues to increase in 2014, it is almost certain the increase will be statistically significant when compared to the baselines.
Non-O157 STEC— Among the STEC non-O157 isolates, the most common serogroups remain: O26 (157 cases, 0.33% cases per 100,000), O103 (116 cases, 0.24 cases per 100,000), and O111 (63 cases, 0.13 cases per 100,000).
Salmonella serotypes— The top three Salmonella serotypes remain: Enteritidis, 1,237 (2.58/100,000); Typhimurium, 917 (1.91/100,000); and Newport, 674 (1.41/100,000). These three represent approximately 40% of all Salmonella illnesses. When compared with 2010-2012 baseline, the incidence was lower for Enteritidis (14%) and Newport (32%) and was unchanged for Typhimurium. Compared with 2006–2008 baseline, the incidence was unchanged for Enteritidis and Newport and 20% lower for Typhimurium.
Regulatory response
Given the lack of progress in 2013, one can expect more regulatory initiatives designed to achieve reductions in foodborne illnesses.
In FSIS’s own report card — http://bit.ly/FSIS2013report — the agency stated that it did not meet its goal of reducing the total number of illnesses attributed to FSIS-regulated products (2013 target: 394,770). FSIS did note that, consistent with the CDC FoodNet findings, the total number of Salmonella illnesses declined from previous years.
However, after mentioning the Salmonella reductions, FSIS states that “agency saw increases in E. coli O157:H7 over the same period.” To address this “increase,” FSIS will use the same approach it used for Salmonella— it will charge the Strategic Performance Working Group with developing an action plan to address E. coli O157:H7.
The year 2013 was not a promising one. As an industry, we need to improve our performance and restart the downward trends we previously achieved.


Report Abusive Comment