Meat processors generate a lot of data during the monitoring of their CCPs and GMPs, associated with their HACCP programs, and this data could be better used by most meat processors to further support their HACCP plans. For example, by the use of tracking and trending, this data could be used to support hazard analysis (417.5(a)(1)) and corrective action decisions (417.5(a)(2)). Also, all HACCP programs require an annual reassessment (417.4(a)(3)), and in order to fulfill this obligation, management must look at a sampling of records, and reassess the deviations and trends that have occurred in the past year.
Tracking and trending of the data that processors generate can help in determining if the process is improving, needs adjustment, or is operating as originally intended. To make sense of this data that has been generated, one needs to statistically analyze it to determine the variation in the results from what has been established to be the limit. For example, if you have set 1½ hours as the critical limit for the time for the internal product temperature to drop from 130ºF to 80ºF during chilling, how consistently are you meeting that critical limit? How much variation is there from one oven load of product to the next in time that it takes to chill from 130ºF to 80ºF?
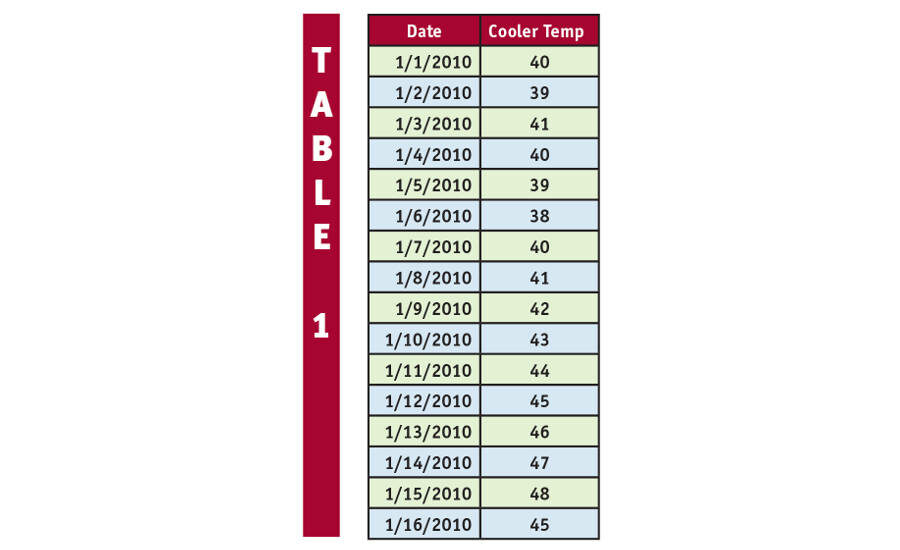
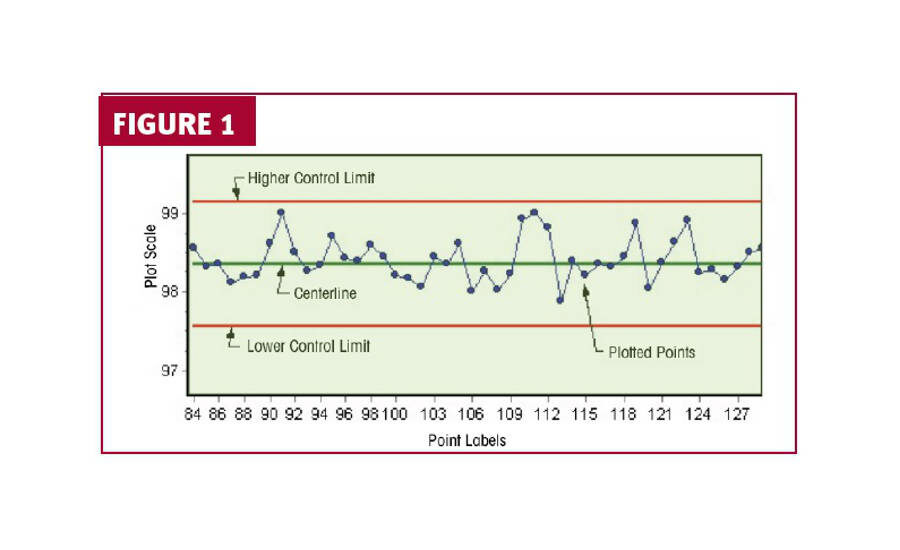
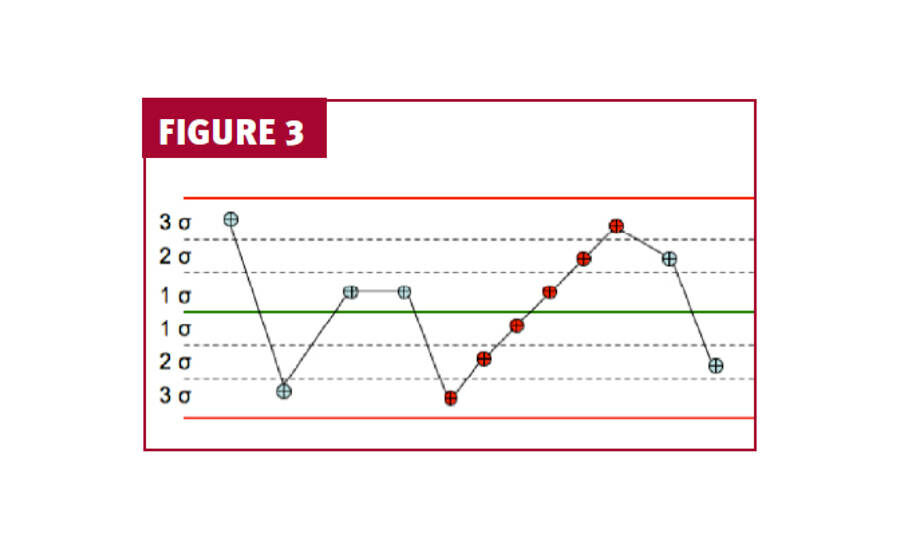
It is understood that not everyone may be comfortable doing statistical analysis, but some relatively simple steps can be taken to tell you a lot about your data. For example, start by graphing your data over time using an Excel spreadsheet. In the example below (Table 1), cooler temperatures have been entered for each day into an Excel spreadsheet. From that data, a graph can be easily made, as seen in Figure 1. On the graph in Figure 1, you could identify your mean temperature over time or critical limit (if it applies) on the graph, as indicated in Figure 2. This data as presented in Figure 2 gives a visual indicator of how consistent the temperatures are in this cooler, making it easier to identify trends. This could just as easily be done by entering your monitoring data for critical limits in your HACCP plan, or your SSOP and your GMP results, to evaluate the consistency in these parts of your HACCP plan. These graphs also make it easier to inform management and regulators about your performance at different critical limits.
When you are comfortable with graphing your data, the next step would be to determine the variation between all of the numbers that you have generated and the mean of these numbers. This is done by calculating the standard deviation. This is done by calculating the standard deviation of your data. There is not space here to explain how to calculate your standard deviation, but some calculators will do that calculation, and you can find explanations on how to calculate standard deviations on the Internet. From the standard deviation that is calculated, you can determine your control limits. Control limits are equal to three times the standard deviation above and below the mean. With a mean and control limits, a control chart can be developed that will visually show the upper and lower limits of variation that can be expected to happen due to random or chance variation.
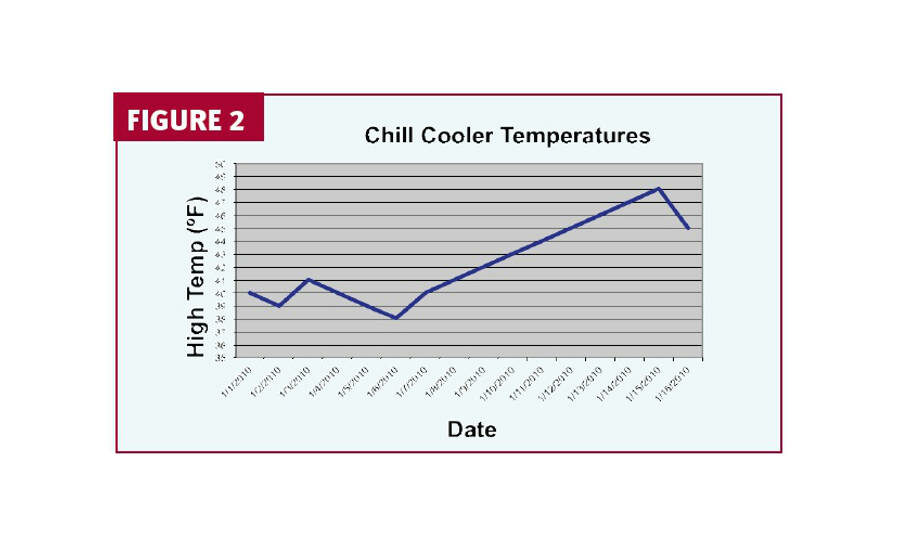
The next challenge is to interpret the control charts that you develop. To consider a process to be under control, you should see the majority of your data points near the mean (centerline), with a few points approaching either the upper or lower control limits. Otherwise, your process may be out of control. Your control chart may also show a trend line developing in your data, as seen in Figure 3.
Regardless of whether you are developing simple graphs that show your data or more complicated control charts, charting your data can help you to determine when your process is out of control, detect shifts in the process early, as well as to help in determining the cause of defects or deviations. Once you have established some history of your processes, data generated in the future can also be compared to past history.
Whereas the application of this concept to food safety is a priority at the moment, you can also apply this tracking and trending concept to product quality parameters, such as piece size or weight, injection yields, cooking yields, package weights, etc.


Report Abusive Comment