Meat department dollars continue on double-digit growth path
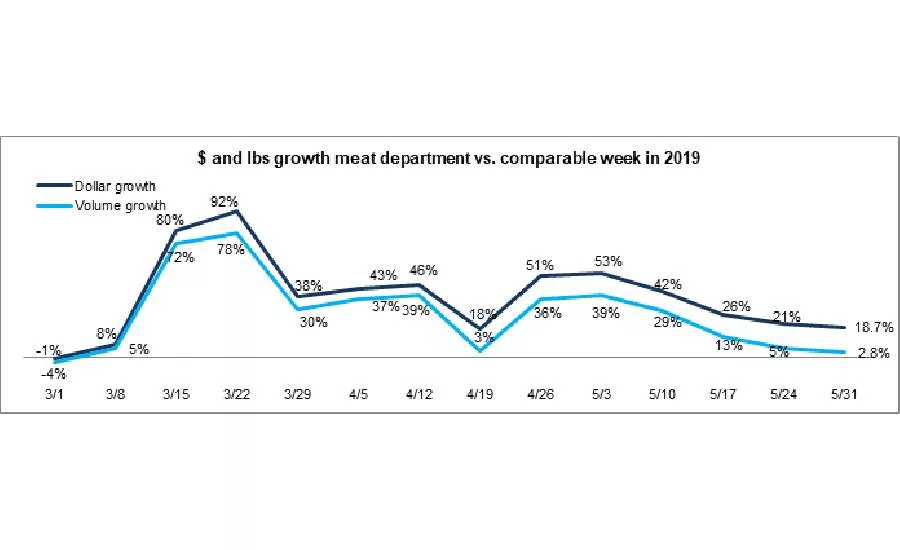
During the final week of May, meat and poultry supply remained tight but demand continued to be elevated. Retail demand stayed well above last year’s baseline even as restaurants around the country started seeing improvements in reservations, transactions and continued elevated engagement with takeout. At retail, purchase limits remained in place for many popular cuts. Prices stayed mostly stable week-over-week but remained up significantly compared with year ago. Despite the supply pressure, dollar sales grew 18.7% the week of May 31 versus year ago and volume grew 2.8%.
Year-to-date through May 31, meat department dollar sales were up 24.4%, boasting double-digit growth for 12 weeks running. This reflects an additional $6.0 billion sold versus the same time period in 2019. Year-to-date volume sales through May 24 were up 16.7% over the same period in 2019, reflecting an additional 1.2 billion pounds of meat and poultry sold versus the same time period in 2019.
Dollar versus Volume Gains
The gap between volume and dollar sales changed slightly and reach its widest point since the onset of coronavirus during the week ending May 31, at 15.9 percentage points. The longer, four-week look ending May 31 showed continued double-digit volume/dollar gaps for fresh beef and pork, but for other fresh species dollars and volume started to track closer together, including chicken and turkey. For exotic meat, volume is actually outpacing dollars.
|
Latest 4 weeks ending May 31, 2020 versus comparable weeks in 2019 |
Dollar gains |
Volume gains |
Volume/dollar gap |
|
Total meat |
+26.8% |
+12.3% |
-14.5 |
|
Fresh beef |
+29.8% |
+8.5% |
-21.3 |
|
Ground beef |
+29.7% |
+4.7% |
-25.0 |
|
Fresh chicken |
+18.1% |
+11.8% |
-6.3 |
|
Fresh pork |
+25.5% |
+8.8% |
-16.7 |
|
Fresh turkey |
+39.7% |
+37.0% |
-2.7 |
|
Fresh lamb |
+37.8% |
+30.7% |
-7.1 |
|
Fresh exotic |
+57.1% |
+59.9% |
+2.8 |
|
Fresh veal |
+21.8% |
+19.4% |
-2.4 |
|
Smoked ham/pork |
+52.5% |
+40.7% |
-11.8 |
|
Sausage |
+31.3% |
+20.6% |
-10.7 |
|
Frankfurters |
+16.3% |
-0.2% |
-16.5 |
|
Bacon |
+27.8% |
+25.1% |
-2.7 |
Source: IRI, Total US, MULO, 4 weeks ending May 31, 2020
The gap in volume versus dollar sales continued to be driven by beef and pork the week ending May 31. During the most recent two weeks, beef volume sales have been down versus the same week in 2019, by about 5%. Volume sales for pork were also off the week of May 31 versus year ago, by just 1%.Total meat volume did increase due to robust gains for chicken and several of the smaller proteins, including turkey and lamb. Supply and demand swings in recent weeks have made demand forecasting extremely difficult, particularly as restaurants are coming back online and consumer uptake for dining out is unclear. “The volatility of supply and demand in the meat department due to COVID-19 have forced some of our grocery clients to adjust their forecast algorithms to give much more weight to the past eight to 10 weeks instead of the typical 52-week seasonal pattern, said Jesus Mathus, Global Head of Retail Solutions, ADC. “This has allowed them to improve their in-stock positions and reduce out-of-stock inventory on key items. Grocers who have implemented perpetual inventory processes to control fresh products tend to be better equipped to react to the current volatility in sales in fresh departments due to the real-time visibility into their in-stock position, which translate into increased accuracy on replenishment orders.”
|
Latest 1 week ending May 31, 2020 versus comparable week in 2019 |
Dollar gains |
Volume gains |
Volume/dollar gap |
|
Total meat |
+18.7% |
+2.8% |
-15.9 |
|
Fresh beef |
+20.7% |
-4.9% |
-25.6 |
|
Ground beef |
+20.9% |
-5.6% |
-26.5 |
|
Fresh chicken |
+11.7% |
+5.1% |
-6.6 |
|
Fresh pork |
+18.4% |
-1.0% |
-19.4 |
|
Fresh turkey |
+29.3% |
+16.1% |
-13.2 |
|
Fresh lamb |
+31.2% |
+28.8% |
-2.4 |
|
Fresh exotic |
+41.4% |
+45.8% |
+4.4 |
Source: IRI, Total US, MULO, 1 week ending May 31, 2020
Supply pressure is lessening going into June. “After two months of disruption, pork plants achieved record slaughter this week,” said Christine McCracken, Executive Director Food & Agribusiness for Rabobank. The net result was to drive pork prices lower, just in time for summer feature activity. Beef is not quite back to its normal run rate, but off just 4% from last year’s slaughter pace. There are a few plants that continue to battle large numbers of COVID-19 cases, but for the most part, the U.S. meat industry is operating at very close to normal levels.” That is a significant improvement from McCracken’s late April reports when beef and pork were at historically low levels, down 35%, each.
McCracken added, “Even as the industry has nearly restored normal production levels, the backlog of just over 3 million market ready pigs and 1 million cattle remains a huge overhang on market values. Even if plants are able to maintain current slaughter rates, which itself would be a tremendous feat given employee fatigue, it will be difficult to work through this inventory before larger seasonal slaughter levels this fall. This unseasonal increase in availability is likely to continue to pressure red meat prices over the summer. Chicken markets remain relatively lackluster, even as QSR demand remains steady and first of the month retail volumes should be supportive. We expect some upward price momentum in coming weeks, as the industry will begin to see the impacts of production cuts taken at the height of COVID-19. Heavier weights are working against the smaller numbers, however, and could limit any substantial increases.”
Assortment
Consumer comments on the Retail Feedback Group Constant Customer Feedback system point to purchase restrictions and limited inventory continuing to impact purchases during the week of May 31. “I realize that meat is a difficult item at this time but to have absolutely no chicken other than expiring whole roasters is ridiculous.” Another wrote, “The meat department was nearly empty. I could not find any sort of roast beef at all.” McCracken explained, “Even with plants operating at relatively normal slaughter levels, tight labor supplies continue to make it difficult for many processors to maximize the value of the carcass. Boning lines remain short, which is limiting availability of some popular items at retail. It is also taking longer to process, as newly implemented safety measures require extra screening and transition time.”
IRI’s measure reflecting the average number of items sold per store decreased again after a small uptick during Memorial Day week to 297. This is the third time the average fell below 300 and reflects 48 fewer items than the same week last year.
The supply chain woes have affected wholesale and retail prices. Several major consumer media outlets ran articles on supply chain buying and pricing in recent weeks. Shoppers called out higher meat prices and fewer meat features on CCF. “A lot of stuff out of stock or more expensive, but to no fault of anyone at the store. It is just the way it is.” Another wrote, “Prices seem higher than usual for meats. I would love to continue shopping here, but I am looking elsewhere. Just not happy with the prices and being sold out of products we need.”
McCracken commented, “Larger supplies of beef and pork, together with somewhat more muted retail and export interest due to price inflation, has resulted in a dramatic shift in market sentiment in the recent week. Prices for many beef and pork items are expected to move lower in an attempt to regain retail interest. The lack of ad activity for Father’s Day and the slowdown at retail has weakened the price outlook for many key items, particularly middle meats. Even so, retailers are shifting promotional activity away from beef for much of the summer as consumer interest has waned at the higher price points.”
IRI’s insights on the average retail price per volume show significant upward year-over-year pressure on retail prices for the week ending May 31 for beef, particularly ground beef, and pork. However, compared to the week prior, prices only increased 2.5%. The average price per volume for turkey and chicken actually decreased from the week prior.
|
Average price per volume |
1 week ending May 31 |
4 weeks ending May 31 |
|||
|
|
Average |
Change vs. prior period |
Change |
Average |
Change vs. year ago |
|
Total meat |
$4.04 |
+2.5% |
+15.5% |
$3.95 |
+12.9% |
|
Fresh beef |
$6.35 |
+2.3% |
+26.9% |
$5.98 |
+19.7% |
|
Ground beef |
$4.98 |
+3.3% |
+29.2% |
$4.69 |
+23.9% |
|
Fresh chicken |
$2.40 |
-0.1% |
+6.3% |
$2.42 |
+5.6% |
|
Fresh pork |
$3.23 |
+6.1% |
+19.6% |
$3.09 |
+15.4% |
|
Fresh turkey |
$3.36 |
-0.6% |
+0.4% |
$3.34 |
+2.0% |
|
Fresh lamb |
$8.43 |
-2.6% |
+4.9% |
$8.30 |
+5.4% |
|
Fresh exotic |
$4.29 |
+1.5% |
-3.1% |
$4.20 |
-1.7% |
Source: IRI, Total US, MULO, 1 week and 4 weeks ending May 31, 2020
Meat Gains by Protein
The overall 18.7% meat department gain was fueled by double-digit gains for all proteins. The two smaller proteins, turkey (+29.3%) and lamb (+31.2%), had the highest percentage gains versus year ago, but beef easily had the highest absolute dollar gains (+$97 million), followed by chicken (+$26 million) and pork (+$22 million). Exotic meat sales gained just under $1 million versus year ago.
As seen throughout the pandemic, many more consumers are cooking and 23% plan to cook from scratch more often going forward. Manufacturers and retailers have an opportunity to innovate around solutions to the top cooking challenges consumers say they are facing, including coming up with new meal ideas, finding inspiration to cook, having the right ingredients on-hand, and accessing more quick and healthy meal creation options.
Grinds
Ground proteins were frequently among those items with purchase limitations in mid-March and again in late April and May. Popular due to their versatility and ease of preparation, grinds achieved big gains over the week ending May 31 versus the comparable week in 2019:
- Ground beef increased 21.9% in dollars but actually lost some ground in volume.
- Ground turkey, +27.2%
- Ground chicken, +26.0%
- Ground pork, +29.7%
For the week ending May 31 versus year ago, these four ground proteins generated an additional $49 million. Since the onset of the pandemic purchasing patterns the week of March 8, these four have sold an additional $1.3 billion versus the same period in 2019.
A Detailed Look by Area
Total meat department sales came in just over $1.4 billion for the week of May 31, with continued gains for the big three (beef, chicken and pork) that have seen double and triple-digit increases ever since the week of March 15. Processed meats, sausages, frankfurters and bacon continued to do extremely well also.
|
|
2020 Weekly $ sales gains versus comparable 2019 week ending… |
$ |
|||||||
|
|
3/1 |
March |
April |
5/3 |
5/10 |
5/17 |
5/24 |
5/31 |
5/31 |
|
TOTAL MEAT |
-1% |
+53.9% |
+38.3% |
+53% |
+42% |
+26% |
+21% |
+18.7% |
$1.4B |
|
Fresh |
|
|
|
|
|
|
|
|
|
|
Beef |
0% |
+53.0% |
+41.6% |
+61% |
+49% |
+30% |
+20% |
+20.7% |
$567M |
|
Chicken |
+1% |
+41.0% |
+31.6% |
+35% |
+28% |
+17% |
+16% |
+11.7% |
$252M |
|
Pork |
-5% |
+56.2% |
+43.5% |
+59% |
+37% |
+21% |
+25% |
+18.4% |
$143M |
|
Turkey |
0% |
+72.1% |
+36.0% |
+55% |
+53% |
+41% |
+34% |
+29.3% |
$41M |
|
Lamb |
+1% |
+33.6% |
+8.4% |
+28% |
+36% |
+40% |
+44% |
+31.2% |
$9M |
|
Exotic |
+5% |
+91.6% |
+53.8% |
+75% |
+71% |
+62% |
+52% |
+41.4% |
$3M |
|
Processed |
|
|
|
|
|
|
|
|
|
|
Smoked ham/pork |
-6% |
+118.2% |
+20.1% |
+103% |
+85% |
+44% |
+39% |
+35.7% |
$16M |
|
Sausage |
0% |
+63.3% |
+41.8% |
+51% |
+41% |
+35% |
+26% |
+24.6% |
$136M |
|
Frankfurters |
-1% |
+76.0% |
+38.8% |
+36% |
+31% |
+20% |
+8% |
+11.2% |
$75M |
|
Bacon |
-6% |
+53.7% |
+47.9% |
+59% |
+40% |
+28% |
+25% |
+18.0% |
$109M |
Source: IRI, Total US, MULO, 1 week % change vs. YA
Market Shifts
Significant differences are observed when comparing dollar protein shares between the first week of March, reflecting pre-pandemic sales levels, and the week ending May 31. While shares are influenced by holidays and differ from week to week, pork and beef’s dollar share continues to be elevated in the one week and year-to-date views, whereas chicken’s share is down in both. The same look at volume shows the effect of pricing, with chicken and pork making up a significantly larger share in volume, but beef being down. Beef volume shares had been tracking ahead, but supply chain tightness pressured the volume share the week of May 31.
|
Dollar sales |
Volume sales |
|||||
|
|
Week ending 3/1/20 |
Week ending 5/31/20 |
Building calendar year 2019 |
Building calendar year 2020 |
Week ending 3/1/20 |
Week ending 5/31/20 |
|
Beef |
53.3% |
55.8% |
54.1% |
55.1% |
37.0% |
35.3% |
|
Chicken |
27.5% |
24.8% |
26.8% |
25.7% |
40.5% |
41.5% |
|
Pork |
12.9% |
14.1% |
13.3% |
13.4% |
16.5% |
17.5% |
|
Turkey |
4.4% |
4.1% |
4.4% |
4.5% |
4.8% |
4.9% |
|
Lamb |
0.9% |
0.9% |
1.0% |
0.9% |
0.4% |
0.4% |
|
Veal |
0.1% |
0.1% |
0.1% |
0.1% |
0.1% |
0.1% |
|
Exotic |
0.3% |
0.3% |
0.3% |
0.3% |
0.2% |
0.3% |
Source: IRI, Total US, MULO, % of total fresh dollars | “All other” not reflected
What’s next?
The next sales report, covering week 14 of coronavirus’ affected shopping patterns, is the first week of June. Many states will have officially started summer vacation, which caused a different demand landscape in prior years versus the months that students are in school. Additionally, sales may have been affected by shortened hours due to local and state-wide curfews.
Meanwhile, the relaxation of the stay-at-home executive orders continued. In most states, consumers are able to resume shopping, dining and working out of home. The speed of economic recovery along with any levels of latent social anxiety will drive the demand for meat coming from foodservice for the foreseeable future. Given the limited seating for in restaurant dining and significant levels of economic pressure, it is likely that demand for meat in retail will continue to track well above 2019 levels for the foreseeable future.
210 Analytics and IRI will provide sales updates weekly. Meanwhile, please thank the entire meat and poultry industry, from farm to store, for all they do to ensure supply during these unprecedented times. #MeatFeedsFamilies #SupermarketSuperHeroes
Source: 210 Analytics/IRI
Looking for a reprint of this article?
From high-res PDFs to custom plaques, order your copy today!