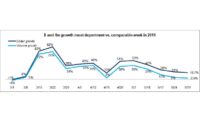
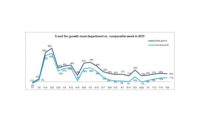
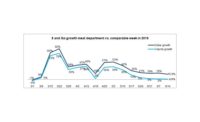
The first week of June marks three full months of coronavirus-related shopping patterns. Following a spike in trips and spending to unprecedented levels in mid-March, the market settled into a period of fewer trips but bigger baskets. The well-publicized meat supply shortages in May drove a rebound in trips for meat whereas purchase limitations and/or limited availability along with high prices started to pressure volume sales. Dollar gains have been trending in the double digits since the onset of the pandemic.
For our first look at June, supply chain issues continued with prices highly elevated over this time last year. Yet, demand remained above last year’s levels in both dollars and volume, even as restaurants around the country started seeing improvements in reservations, transactions and continued record levels of takeout business. At retail, purchase limits started to resolve, though geographic differences were significant. During the first week of June, dollar sales grew 19.4% versus year ago and volume grew 1.9%, its lowest gain since the first week of March. Shoppers may be using their freezer stash as back up and are also highly engaged with seafood, frozen meat and frozen seafood sales, that have all been highly elevated for weeks.
Year-to-date through June 7, meat department dollar sales were up 24.2%, boasting double-digit growth for the months of March, April and May. This reflects an additional $6.2 billion sold versus the same time period in 2019. Year-to-date volume sales through June 7 were up 16.1% over the same period in 2019, reflecting an additional 1.2 billion pounds of meat and poultry sold versus the same time period in 2019.
Dollar versus Volume Gains
The gap between volume and dollar sales reached another high since the onset of coronavirus during the week ending June 7, at 17.5 percentage points. The longer, four-week look ending June 7 showed double-digit volume/dollar gaps for fresh beef and pork, that in turn caused a double-digit volume/dollar gap for total meat.
In fact, volume gains in the four-week look for beef, including ground beef, turned negative for the first time since the onset of Coronavirus in the US. The volume/dollar gap for chicken, turkey and lamb narrowed compared with prior week reports. For exotic meat, volume gains actually outpaced dollar gains over the four week look.
|
Latest 4 weeks ending June 7, 2020 versus comparable weeks in 2019 |
Dollar gains |
Volume gains |
Volume/dollar gap |
|
Total meat |
+21.3% |
+5.7% |
-15.6 |
|
Fresh beef |
+23.2% |
-1.5% |
-24.7 |
|
Ground beef |
+23.5% |
-3.8% |
-27.3 |
|
Fresh chicken |
+13.8% |
+7.0% |
-6.8 |
|
Fresh pork |
+20.8% |
+2.8% |
-18.0 |
|
Fresh turkey |
+31.4% |
+29.7% |
-1.7 |
|
Fresh lamb |
+39.3% |
+34.7% |
-4.6 |
|
Fresh exotic |
+50.2% |
+52.7% |
+2.5 |
|
Fresh veal |
+22.3% |
+20.8% |
-1.5 |
|
Smoked ham/pork |
+37.9% |
+26.6% |
-11.3 |
|
Sausage |
+26.6% |
+16.6% |
-10.0 |
|
Frankfurters |
+13.5% |
-3.2% |
-16.7 |
|
Bacon |
+22.5% |
+16.6% |
-5.9 |
Source: IRI, Total US, MULO, 4 weeks ending June 7, 2020 versus YA
Total meat volume increased over the first week of June due to gains for chicken and several of the smaller proteins, including turkey, lamb and exotic meats. Just like seen in the four-week view, the gap in volume versus dollar sales was driven by beef and pork. Beef volume sales gains have been negative for three weeks straight and deteriorated from -4.9% during the last week of May to -7.1% the first week of June. Volume sales for pork recovered from a loss the week prior to a small gain during the week of June 7. Supply and demand swings in recent weeks have made demand forecasting extremely difficult, particularly as restaurants are coming back online and consumer uptake for dining out is unclear.
|
Latest 1 week ending June 7, 2020 versus comparable week in 2019 |
Dollar gains |
Volume gains |
Volume/dollar gap |
|
Total meat |
+19.4% |
+1.9% |
-17.5 |
|
Fresh beef |
+23.3% |
-7.1% |
-30.4 |
|
Ground beef |
+23.4% |
-7.7% |
-31.1 |
|
Fresh chicken |
+10.9% |
+3.0% |
-7.9 |
|
Fresh pork |
+17.9% |
+0.6% |
-17.3 |
|
Fresh turkey |
+21.7% |
+19.5% |
-2.2 |
|
Fresh lamb |
+41.5% |
+36.7% |
-4.8 |
|
Fresh exotic |
+45.2% |
+46.1% |
+0.9 |
Source: IRI, Total US, MULO, 1 week % gain versus YA
Assortment
Consumer comments on the Retail Feedback Group Constant Customer Feedback system showed a split experience relative to purchase restrictions and inventory as supply is highly regionally impacted. Some commented on the vast improvement in supply versus prior weeks, whereas others continued to face low levels of meat availability during the week of June 7. “I understand we are in the virus times, but the meat assortment was scarce. Not a complaint, I totally understand, just frustrated.” Another wrote, “The meat department looked like they were getting more stock for the shelves. Better choices available than seen in weeks.” Along those lines, another shopper wrote, “Glad to see more products available and no limit on fresh meats.”
IRI’s measure reflecting the average number of items sold per store indeed showed a small improvement to 300. This reflects 45 fewer items than the same week last year.
|
Average weekly items per store selling for week ending… |
||||||||||||||
|
3/1 |
3/8 |
3/15 |
3/22 |
3/29 |
4/5 |
4/12 |
4/19 |
4/26 |
5/3 |
5/10 |
5/17 |
5/24 |
5/31 |
6/7 |
|
335 |
334 |
353 |
330 |
308 |
318 |
318 |
314 |
310 |
309 |
303 |
296 |
299 |
297 |
300 |
Source: IRI, Total US, MULO, average weekly items per store selling
The supply chain woes have affected wholesale and retail prices. Shoppers called out higher meat prices and fewer meat features on CCF. “With meat prices, and all prices these days, so much higher, it was great to find three meat selections that were marked down and were smaller size packages. I am a senior and single so big packages are not what I want or need.” Another shopper said, “The meat was expensive, but I understand and appreciate there are a lot of extra measures everyone in the supply chain is taking, so I can understand why things are more expensive.” IRI’s insights on the average retail price per volume show significant upward year-over-year pressure on retail prices for the week ending June 7 for beef, particularly ground beef. However, pork prices were more favorable the first week of June versus the week prior, though still up 17.2% over year ago.
|
Average price per volume |
1 week ending June 7 |
4 weeks ending June 7 |
|||
|
|
Average |
Change vs. prior period |
Change |
Average |
Change vs. year ago |
|
Total meat |
$4.08 |
+1.1% |
+17.2% |
$3.99 |
+14.8% |
|
Fresh beef |
$6.50 |
+2.3% |
+32.7% |
$6.19 |
+25.1% |
|
Ground beef |
$5.05 |
+1.3% |
+33.7% |
$4.86 |
+28.4% |
|
Fresh chicken |
$2.46 |
+2.3% |
+7.6% |
$2.43 |
+6.4% |
|
Fresh pork |
$3.19 |
-1.4% |
+17.2% |
$3.14 |
+17.6% |
|
Fresh turkey |
$3.37 |
+0.4% |
+1.8% |
$3.25 |
+1.3% |
|
Fresh lamb |
$8.36 |
+1.8% |
+3.6% |
$8.24 |
+3.4% |
|
Fresh exotic |
$4.35 |
+0.0% |
-0.6% |
$4.29 |
-1.6% |
Source: IRI, Total US, MULO, 1 week and 4 weeks ending June 7, 2020
Christine McCracken, Executive Director Food & Agribusiness for Rabobank, is expecting the supply and pricing landscape to look very different in the upcoming weeks. “Plentiful protein supplies and lackluster foodservice interest continue to weigh on beef, pork and chicken values. Wholesale beef prices fell sharply the first week of June (down 19% from last week) as harvest levels averaged just 2% below year-ago. After falling 48% in the past month, beef prices are attracting the attention of retail buyers looking for last minute Father’s Day items, especially middle meats. Pork prices also moved lower (down 8% from the prior week) on another strong week of production. Loins were down sharply (down 21% week/week) as retailers began to look for less expensive alternatives, while hams and bellies were slightly higher. We expect harvest levels to remain elevated throughout the summer as packers work through the backlog of pigs delayed due to plant closures. Chicken prices remain depressed (down 2% versus last week), despite estimated slaughter down 6% from year ago as the impact of production cuts begin to take effect. We expect further production declines in the coming week and for prices to begin to stabilize. Jumbo breast meat continues to trade at a steep discount, but should begin to see slightly improved values as the impact of production cuts take effect and foodservice sees further improvement.”
Meat Gains by Protein
The overall 19.4% meat department gain was fueled by double-digit gains for all proteins. The two smaller proteins, turkey (+21.7%) and lamb (+41.5%), had the highest percentage gains versus year ago, but beef easily had the highest absolute dollar gains (+$108 million), followed by chicken (+$26 million) and pork (+$22 million). Exotic meat sales gained just under $1 million versus year ago and had even higher gains than turkey and lamb.
Grinds
While ground beef saw a dollar gain of 23.4% driven by much higher prices over the week of June 7 versus year ago, volume sales were off 7.7% the same time period in 2019. Consumers looked for equally versatile but less expensive alternatives and smaller proteins stepped in. Ground turkey, chicken, pork and exotic meats, such as bison, all saw highly elevated gains in both dollars and volume.
- Ground beef increased 23.4% in dollars but was down -7.7% in volume.
- Ground turkey, +17.5% in dollars and +13.3% in volume.
- Ground chicken, +20.1% in dollars and +12.4% in volume
- Ground pork, +22.6% in dollars and +9.3% in volume.
For the week ending June 7 versus year ago, these four ground proteins generated $268 million in sales, which represents an additional $50 million versus year ago.
The Pandemic Sales Performance by Area
Total meat department sales came in just under $1.4 billion for the week of June 7. Growth percentages for most of the proteins are tapering off compared with mid-March, April and May, but some of the smaller proteins continued to see high gains of their much smaller base.
|
|
2020 Weekly $ sales gains versus comparable 2019 week ending… |
$ |
||||||||
|
|
3/1 |
March |
April |
5/3 |
5/10 |
5/17 |
5/24 |
5/31 |
6/7 |
6/7 |
|
TOTAL MEAT |
-1% |
+54% |
+38% |
+53% |
+42% |
+26% |
+21% |
+19% |
+19.4% |
$1.4B |
|
Fresh |
|
|
|
|
|
|
|
|
|
|
|
Beef |
0% |
+53% |
+42% |
+61% |
+49% |
+30% |
+20% |
+21% |
+23.3% |
$571M |
|
Chicken |
+1% |
+41% |
+32% |
+35% |
+28% |
+17% |
+16% |
+12% |
+10.9% |
$261M |
|
Pork |
-5% |
+56% |
+44% |
+59% |
+37% |
+21% |
+25% |
+18% |
+17.9% |
$146M |
|
Turkey |
0% |
+72% |
+36% |
+55% |
+53% |
+41% |
+34% |
+29% |
+21.7% |
$42M |
|
Lamb |
+1% |
+34% |
+8% |
+28% |
+36% |
+40% |
+44% |
+31% |
+41.5% |
$9M |
|
Exotic |
+5% |
+92% |
+54% |
+75% |
+71% |
+62% |
+52% |
+41% |
+45.2% |
$3M |
|
Processed |
|
|
|
|
|
|
|
|
|
|
|
Smoked ham/pork |
-6% |
+118% |
+20% |
+103% |
+85% |
+44% |
+39% |
+36% |
+33.0% |
$17M |
|
Sausage |
0% |
+63% |
+42% |
+51% |
+41% |
+35% |
+26% |
+25% |
+21.8% |
$133M |
|
Frankfurters |
-1% |
+76% |
+39% |
+36% |
+31% |
+20% |
+8% |
+11% |
+17.0% |
$67M |
|
Bacon |
-6% |
+54% |
+48% |
+59% |
+40% |
+28% |
+25% |
+18% |
+18.8% |
$114M |
Source: IRI, Total US, MULO, 1 week % change vs. YA
Market Shifts
Beef and pork have a much higher share of dollar sales both in the one week view comparing the week ending June 7 to year ago and the building calendar years in 2019 and 2020. Pork also saw its share of volume rise, but beef’s dollar share gain did not result in an increased share of volume. As chicken prices have been depressed in recent weeks, its weekly share is down, but its volume share is up compared to the same week year ago.
|
Share of dollar sales |
Share of volume sales |
|||||
|
|
Week ending 3/1 |
Week ending 6/7 |
Building calendar year 2019 |
Building calendar year 2020 |
Week ending |
Week ending |
|
Beef |
53.3% |
55.3% |
53.8% |
55.1% |
37.0% |
34.5% |
|
Chicken |
27.5% |
25.3% |
25.9% |
25.6% |
40.5% |
41.8% |
|
Pork |
12.9% |
14.1% |
13.3% |
13.5% |
16.5% |
18.0% |
|
Turkey |
4.4% |
4.0% |
5.6% |
4.5% |
4.8% |
4.9% |
|
Lamb |
0.9% |
0.9% |
0.9% |
0.9% |
0.4% |
0.4% |
|
Veal |
0.1% |
0.1% |
0.1% |
0.1% |
0.1% |
0.1% |
|
Exotic |
0.3% |
0.3% |
0.3% |
0.3% |
0.2% |
0.3% |
Source: IRI, Total US, MULO, % of total meat department dollars | “All other” not reflected
What’s Next?
The meat demand landscape continues to evolve as restaurants around the country are allowed to reopen, albeit with social distancing measures in place. Additionally, many states will have officially started summer vacation, but fewer consumers are traveling compared with prior years. Summer get-togethers and holiday celebrations may still look very different, particularly in hard-hit areas. Father’s Day is around the corner, traditionally a strong meat holiday, but high prices may affect consumer demand. Additionally, grocery sales overall may have been affected by shortened hours due to local curfews, particularly in urban areas.
Between the continued impact of COVID-19 and significant economic pressure, it is likely that demand for meat in retail will continue to track well above 2019 levels for the foreseeable future. 210 Analytics and IRI will provide sales updates weekly. Meanwhile, please thank the entire meat and poultry industry, from farm to store, for all they do to ensure supply during these unprecedented times. #MeatFeedsFamilies #SupermarketSuperHeroes
Source: 210 Analytics/IRI


Report Abusive Comment