Beef demand remains strong
Consumer perceptions of beef remain positive despite overall declining consumer sentiment.
During a year when consumers have been reeling from record-setting inflation levels and supply chain issues, demand for beef has remained strong, and online grocery beef purchases continue to grow. Beef quality and consumers’ perceptions of beef remain positive this year in the face of overall declining consumer sentiment.
Beef prices and demand
Prices for virtually every good has seen price increases during the first half of 2022. Between July 2021 and July 2022, prices for All Items (as defined by the Consumer Price Index) rose by 8.5%, while prices for all food items rose by 10.9% and energy prices rose by 32.9%2. However, within the food category, beef and veal prices increased by 3.4%, whereas egg and poultry prices have increased by 38% and 16.6%, respectively2. In fact, beef and veal prices have seen the lowest level of price percent increase out of the major protein categories (beef, poultry, eggs, pork, and seafood) between July 2021 – July 20222. Beef prices have seen downward pressures partially due to an increased supply of cattle heading to slaughter because of drought conditions and a lack of rain within the major cattle-producing states.
While these increased price levels are likely to have strained household food budgets, willingness to pay for beef remains strong. As Figure 1 shows, willingness to pay for steak has topped the average price per pound between April – June 20221. Willingness to pay for steak hasn’t exceeded the average price per pound since April – June 2021, indicating that consumers still find value in purchasing beef, despite uncertainties within the broader economy.
Figure 1. Historical consumer willingness to pay at retail for beef steak1
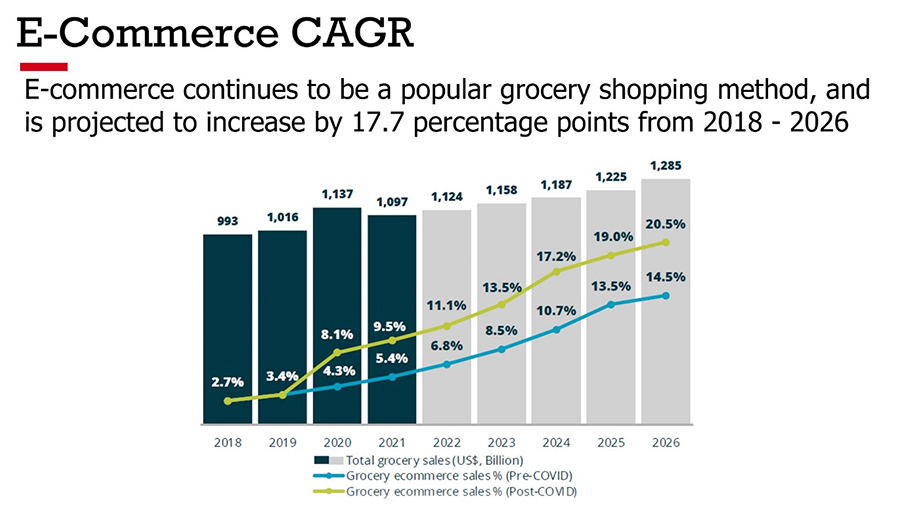
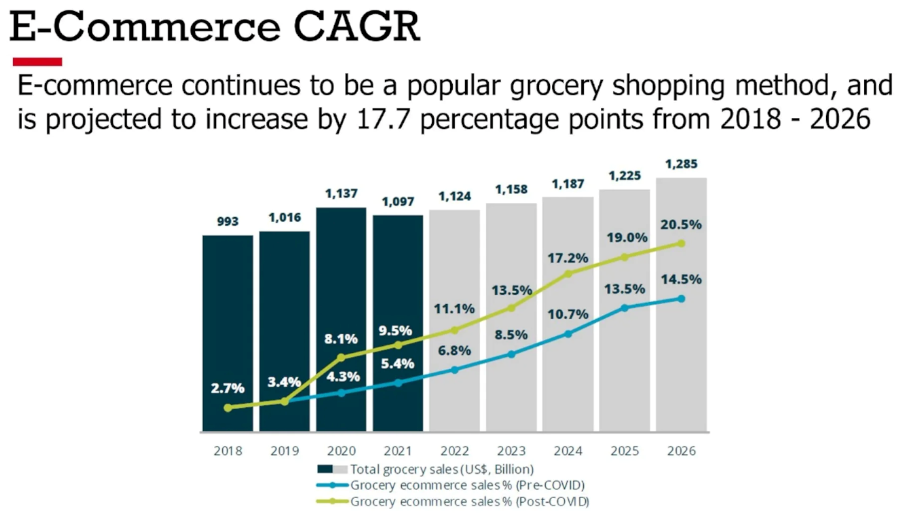
Figure 2. E-commerce compound annual growth rate for grocery sales3
E-commerce
An area that continues to see tremendous opportunity and growth in the marketplace is e-commerce. Throughout the grocery shopping space, Figure 2 shows that the compound annual growth rate has been projected to continually increase and account for 20% of total grocery sales by 20263. Online retail sales for the first quarter of 2022 totaled $231.4 billion, which is 14.3% of the total quarterly retail sales, an increase of 7% from the first quarter of 2021, and a 2.4% increase from the fourth quarter of 20214. Consumers are increasingly choosing home delivery as their preferred mode of shopping when compared to click collect in September of 2020. Fast forward to December 2021, and 63% of surveyed consumers preferred home delivery, while 37% preferred click-and-collect methods5.
Beef is a big part of the success in this area, with 44% of consumers including beef in their online carts, and 25% of these consumers included beef within the last month6. This is up 7% since the July 20216 study. Not only are consumers ordering beef more often, but they are also happy with the experience they are getting. In fact, 91% of beef roast purchasers claimed to be satisfied with the beef they ordered online6. Similarly, 93% of beef steak purchasers claimed to be satisfied with the beef they purchased online and 94% of ground beef purchasers claimed to be satisfied with the beef they purchased online6.
Retail and foodservice
As inflationary pressures continue to affect household budgets, there were concerns that beef might suffer at retail and foodservice as consumers may shift preferences. However, 2022 beef retail sales have exceeded $20.1 billion for 2022 (38 weeks ending 8/13/2022), and currently account for 54% of total retail fresh meat sales7. This figure is also a 4.6% increase in beef sales during the same period in 2021 and is currently on par with the same period in 20207. While retail sales ($) may be up year over year, pounds of beef sold are currently 5.7% down compared 2021 and 12.1% down compared to 20207.
The food service sector shares a similar story, as the NPD Group reports that physical and online restaurant traffic has declined by 2% in the second quarter of 20228. Consumers have also claimed that budgetary concerns are one of the most important considerations when deciding whether to dine at a restaurant or to dine at home, second only to taste1. Additionally, consumer spending within restaurants saw a decrease of 2%, possibly because of increased prices, a phenomenon also observed within the retail beef market8.
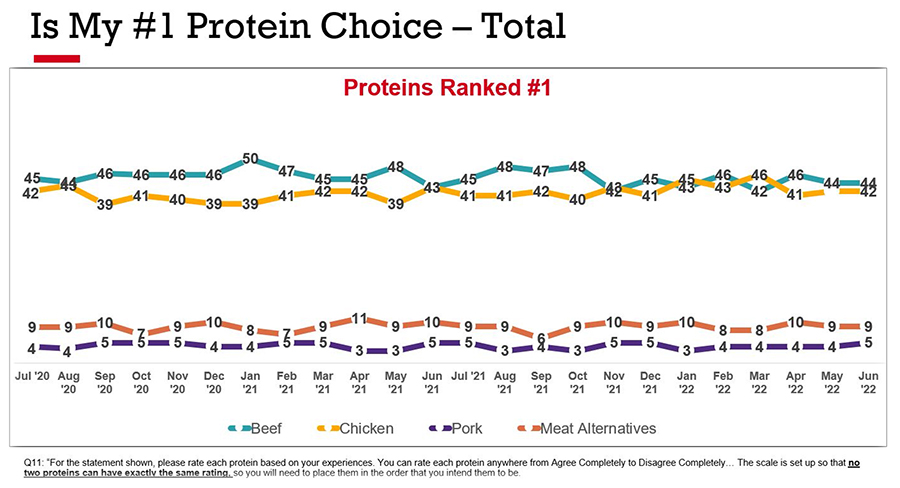
Figure 3. Satisfaction levels of various proteins1
Beef quality and satisfaction
As of July 2022, more than 80% of beef graded obtains the highest available USDA quality grades of Prime or Choice9. According to the USDA grading standards, choice and prime-graded beef contain abundant marbling, tenderness, juiciness, and flavor10. These factors all contribute to an enjoyable eating experience, which is paramount to maintaining a strong consumer base.
As figure 3 shows, when consumers are asked to rank various proteins by satisfaction levels, beef has consistently been ranked as a top protein choice. Additionally, beef has consistently been a top-ranked protein source for versatility, protein density, taste, and overall nutritional content1. These facts, combined with the strong willingness to pay discussed above, show that beef remains a high priority in the minds of consumers, and that satisfaction will continue to play a pivotal role in the continued success of beef.
Figure 4. Market share of animal proteins vs. meat alternatives1

Meat substitutes
As of August 13, 2022, fresh meat alternatives represented less than 1% of both the entire fresh protein retail market (0.34%) and the fresh beef retail market specifically (0.54%)7. For comparison, beef currently occupies 54% of the fresh protein market, and occupied almost 56% of the fresh protein market during the same timeframe in 20217. Market share for alternative proteins has also been declining for the past two years, declining over 20% from 2021 to 2022 and declining almost 8% from 2020 to 20217.
Most consumers who choose to eat meat alternatives do not cut out other protein sources from their diets1. According to NCBA’s Consumer Beef Tracker, people who consume meat alternatives on a weekly-or-more basis also consume beef and other proteins as much as the average consumer1. Additionally, the current share of consumers entirely avoiding ground meat and only purchasing meat alternatives was estimated at around 3% between November 2018 – November 202011. Out of all households that purchased meat alternatives, 86% also purchased ground meat11.
Consumers’ perceptions
Tracking consumer perceptions in 2022 points to a bright story and great opportunity for beef. NCBA’s Consumer Beef Tracker data, funded by the Beef Checkoff, allows for ongoing tracking of consumer perceptions. According to the most recent data, over two-thirds of consumers maintain positive perceptions of beef overall1. Additionally, a majority of consumers perceive beef as a healthy choice and as a lean source of protein1. When asked about the credibility of certain sources of information, over half of respondents considered farmers and ranchers to be credible when it comes to production practices1. Consumers have also consistently ranked beef to be a high-quality versatile protein1. When compared to other protein sources, beef is considered to be great tasting, good for many types of social occasions, nutritious, and raised humanely1.
Hailey Thayn is manager of public relations and content for the National Cattlemen’s Beef Association.
References
- Consumer Beef Tracker, Directions Research, analyzed and summarized by NCBA, on behalf of the Beef Checkoff, 2019 – 2022.
- Consumer Price Index, Bureau of Labor Statistics, Processed August 2022.
- Mercatus and Incisiv, eGrocery Transformed, 2021.
- U.S. Census Bureau, Quarterly U.S. Retail E-Commerce Sales, May 2022.
- McKinsey and Company, Navigating the Market Headwinds: The State of Grocery Retail 2022, May 2022.
- State of the Consumer Survey, Dynata Platforms, analyzed and summarized by NCBA, on behalf of the Beef Checkoff, August 2022.
- NielsonIQ, Discover, Year-to-Date (38 weeks ending 8/13/2022) Sales and Volume data, Year-Ago (38 weeks 2021) Sales and Volume data, Two Years-Ago (38 weeks 2020) Sales and Volume data, Processed 8/23/2022.
- The NPD Group, “Inflation and Rising Menu Prices in Second Quarter Keep U.S. Restaurant Visits Below a Year Ago”. July 27, 2022.
- Agricultural Marketing Service, United States Department of Agriculture, July 2022
- Meadows, Larry, et al. “What’s Your Beef – Prime, Choice, or Select?” Agricultural Marketing Service, United State Department of Agriculture 12 Sept 2019, https://www.usda.gov/media/blog/2013/01/28/whats-your-beef-prime-choice-or-select?page=1.
- Neuhofer, Z.T., Lusk, J.L. Most plant-based meat alternative buyers also buy meat: an analysis of household demographics, habit formation, and buying behavior among meat alternative buyers. Sci Rep 12, 13062 (2022). https://doi.org/10.1038/s41598-022-16996-5.
Looking for a reprint of this article?
From high-res PDFs to custom plaques, order your copy today!


