Packaging Tech
Continued growth expected in flexible packaging
U.S. flexible packaging industry annual sales reach $30.2 billion for 2016.
The Flexible Packaging Association’s (FPA) annual U.S. State of the Flexible Packaging Industry Report (SOI) is a key resource for U.S. flexible packaging industry data and information. The 2017 SOI provides industry converters, suppliers, investors and analysts with insight into the performance of the U.S. flexible packaging industry over the past year.
Industry performance
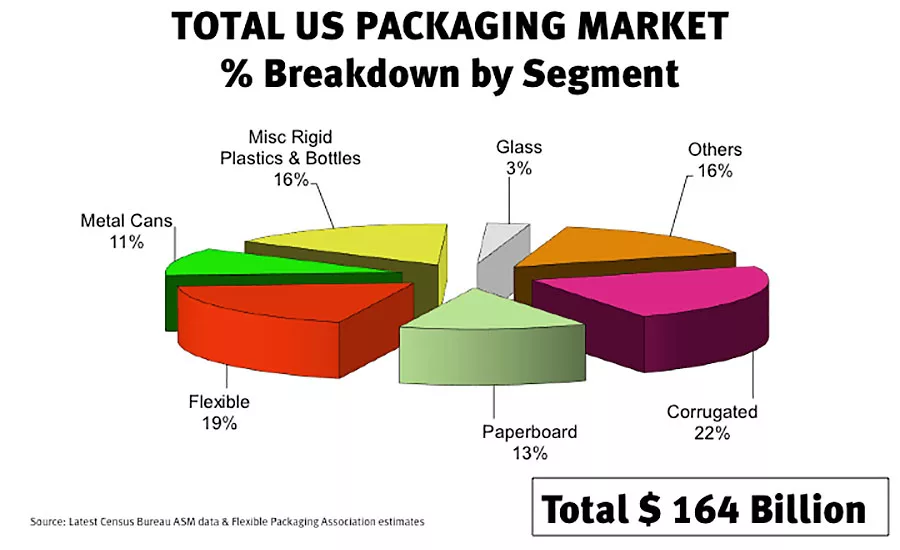
The U.S. flexible packaging industry is estimated to be about $30.2 billion in annual sales for 2016. It represents 19 percent of the $164 billion U.S. packaging industry and is the second largest segment behind corrugated paper. According to the report, growth of the U.S. flexible packaging industry has been steady over the past 10 years with a compound annual growth rate (CAGR) of 1.9 percent and a 2016 annual growth rate of 2.4 percent. FPA estimates that the industry will increase to $31 billion in 2017.
Materials and processes
Flexible packaging companies utilize a number of materials and processes to produce flexible packaging. Film and sheet and plastic resins account for 69 percent of the materials used in the U.S. flexible packaging industry. Inks account for approximately 8 percent; paper, 7 percent; foil, 4 percent; and coatings and adhesives, 4 percent. The report details that polyethylene (PE) film is used by 83 percent of survey respondents and accounts for 41 percent of total film use. PE resin is used by 82 percent of survey respondents and accounts for 79 percent of total resin use.
End uses
Steady growth and expansion of the $30.2 billion flexible packaging industry has been aided by innovation in technology and products, growth in new and existing markets and an ability to adapt to the changing environment of today’s marketplace and consumers. According to this year’s SOI, 58 percent of flexible packaging is used for food sold through retail outlets and food sold to institutions. This year’s composite data results also provided additional detail/estimates for beverages at 9 percent, personal care at 6 percent, pet food at 5 percent and tobacco at 3 percent. Based on the latest Census Bureau data available (2015), the value of product shipments for fish and seafood is $11,463 million; processed meats, $47,889 million; and poultry, $63,019 million.
Industry structure
In 2016, the U.S. flexible packaging industry recorded 20 M&A domestic transactions, a slight increase from the 18 completed in 2015. The report provides additional information on industry structure by revenue and company size, M&A activity from 2001 to 2016 (U.S.), planned acquisition activity and worldwide M&A activity. NP
Looking for a reprint of this article?
From high-res PDFs to custom plaques, order your copy today!