Lamb and exotic meat grow, meat alternatives drop in July 2021
The normalization of shopping patterns seen in the first six months of 2021 continued in July. Even more trips shifted back to in-store that now account for 87% of all trips. Shoppers also averaged 32.3 minutes, the longest since March 2020. The share of home-prepared meals dropped to 76.6% of all meal occasions in July 2021, which is down from 82.0% in July 2020.
At the same, more consumers ate on premise at restaurants (50%), while restaurant takeout (53%) and delivery (21%) remained high. This ever-changing grocery and restaurant landscape is prompting continued changes for meat sales also. IRI and 210 Analytics analyzed the retail meat department performance in the first seven months of the year along with a July performance deep dive. The report is made possible by Marriner Marketing.
Inflation
Meat prices, along with food inflation across the store, remained a big topic of discussion in July. IRI-measured price inflation shows that prices continued to rise 3%-4% over and above their elevated 2020 levels for total food and beverages in recent weeks. Meat prices (dollars divided by volume average at retail) were favorable than those last year throughout all of May and June, but prices did rise year-over-year come July. The last three weeks of July shows year-over-year inflation of about 3%-4%, in line with total food and beverages. The July numbers from the Bureau of Labor Statistics (BLS) are scheduled to be released on August 11, 2021.
Price per Volume
Across all measured meat and poultry items in the IRI retail universe, both fixed and random weight, the average price per pound volume stood at $3.89 in the first quarter of 2021 and rose to $4.08 in the second quarter. The average increased to $4.26 in July 2021. Price increases have affected fresh meat more than processed meat. Year-over-year, the average price per pound increased +6.0% for fresh meat and only +2.7% for processed meat in July 2021.
Meat Sales During the First Seven Months of 2021
Few departments are able to keep pace with their record 2020 sales and meat is no exception. During the first seven months of 2021, sales fell 4.5% when compared to the same time period in 2020. Fresh meat sales accounted for slightly more of that loss, at -5.2%. However, meat department sales are trending well ahead of the first seven months of 2019, at +17.1%, driven by the average number of at-home meals still higher than pre-pandemic where food service was more evenly mixed in the household routine. “Shoppers are more accustomed to cooking now, so even as restaurants and mobility renews, eating at home is still seen as a cost savings,” said Jonna Parker, team lead for IRI Fresh.
|
Meat department — Year-to-date January through July 2021 |
Dollar |
Dollar gains |
Dollar gains |
|
Total meat department |
$46.2B |
-4.5% |
+17.1% |
|
Fresh meat |
$31.0B |
-5.2% |
+18.0% |
|
Processed meat |
$15.3B |
-3.1% |
+15.3% |
Source: IRI, Integrated Fresh, Total US, MULO, see end for time period definitions
The pattern is very similar for year-to-date volume (pound) sales. The total meat department sold 7.8% fewer pounds in the first months of 2021 than in 2020. However, meat pound sales are tracking 4.7% ahead of the first seven months of 2019.
|
Meat department — Year-to-date January through July 2021 |
Volume (lbs) |
Volume gains |
Volume gains |
|
Total meat department |
$11.5B |
-7.8% |
+4.7% |
|
Fresh meat |
$8.0B |
-8.3% |
+4.2% |
|
Processed meat |
$3.5B |
-6.8% |
+5.9% |
Source: IRI, Integrated Fresh, Total US, MULO, see end for time period definitions
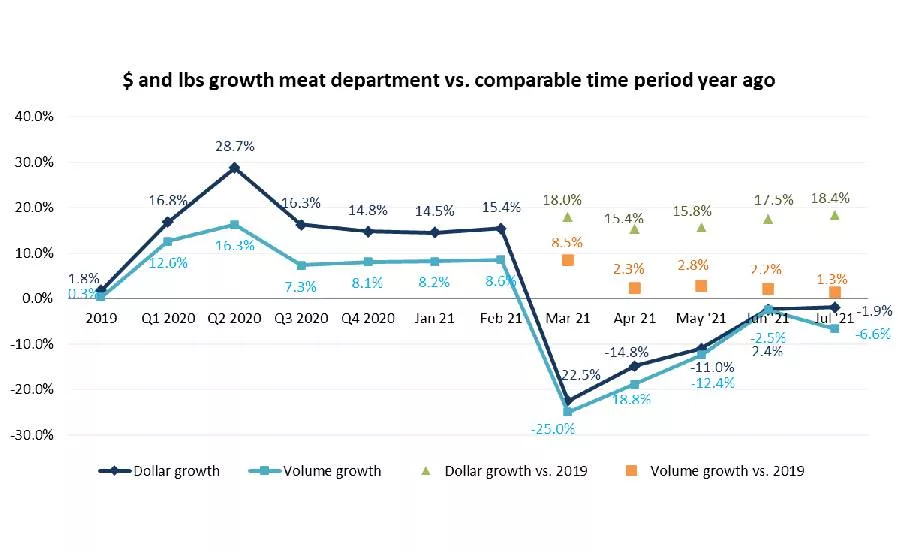
Week-by-Week July Sales
Independence Day week was the biggest of the four July weeks, at $1.8 billion in sales. Despite more Americans celebrating with gatherings for the holiday, this was down about 5% from last year.
The subsequent July weeks average $1.5 to $1.6 billion in sales and came closer to the everyday July sales levels seen in 2020. All July weeks came in double digits ahead of the 2019 sales results.
However, the drop of home-prepared meals and the return to on-premise restaurant dining did result in the lowest volume gains versus the 2019 normal, at +1.3%. This is down nearly one percentage point from June.
Assortment
The meat department has yet to fully recover from the deep drop in assortment that took place in the early months of the pandemic. While the average items per store have recovered beyond the 2020 level come July 2021 (+4.6%), they are still tracking 4.5% behind the 2019 pre-pandemic normal.
|
|
Average meat department items per store selling for week ending… |
||||||||
|
|
2019 |
Q1 20 |
Q2 20 |
Q3 20 |
Q4 20 |
Q1 21 |
Q2 21 |
July 21 |
|
|
Items |
566 |
560 |
517 |
529 |
546 |
545 |
547 |
547 |
|
|
Change |
-1.0% |
-1.3% |
-9.0% |
-5.8% |
-3.7% |
-2.8% |
+6.2% |
+4.6% |
|
Source: IRI, Integrated Fresh, Total US, MULO, average items per store selling
Fresh Meat by Protein — Lamb and Exotic Meats Gain
The trend of down year-over-year results but continued elevated demand versus 2019 holds true for most individual proteins as well. There are two exceptions, being lamb and exotic meats, which includes bison. Both managed to grow year-over-year sales, at +2.1% and +0.8%, respectively. This is despite a very strong 2020 performance for these smaller sellers, as is attested by huge gains versus 2019, at +41.5% and +32.3%, respectively.
|
July 2021 |
|
$ sales gains versus comparable period year ago |
||||||||
|
|
2019 |
Q1 ‘20 |
Q2 ‘20 |
Q3 ‘20 |
Q4 ‘20 |
Q1 ‘21 |
Q2 ‘21 |
Jul ‘21 |
Jul vs ‘20 |
Jul vs ‘19 |
|
Total fresh meat |
+1.7% |
+16.9% |
+32.0% |
+18.0% |
+15.9% |
+0.6% |
-10.9% |
$4.3B |
-3.0% |
+20.0% |
|
Fresh beef |
+2.2% |
+18.0% |
+35.7% |
+22.6% |
+18.6% |
+2.2% |
-10.7% |
$2.4B |
-4.0% |
+23.7% |
|
Fresh chicken |
+1.7% |
+13.9% |
+23.0% |
+10.5% |
+13.4% |
-1.0% |
-9.6% |
$1.0B |
-2.3% |
+11.2% |
|
Fresh pork |
+0.1% |
+16.5% |
+33.6% |
+13.9% |
+12.3% |
-2.3% |
-14.6% |
$613M |
-0.8% |
+20.4% |
|
Fresh turkey |
-1.2% |
+17.2% |
+30.4% |
+9.1% |
+9.5% |
-6.8% |
-17.3% |
$140M |
-1.5% |
+12.1% |
|
Fresh lamb |
+2.3% |
+9.4% |
+25.3% |
+30.5% |
+33.6% |
+23.4% |
+1.6% |
$38M |
+2.1% |
+41.5% |
|
Fresh exotic |
+2.8% |
+18.6% |
+47.6% |
+24.4% |
+23.2% |
+4.1% |
-12.7% |
$8.8M |
+0.8% |
+32.3% |
|
Veal |
-8.4% |
+0.5% |
+16.6% |
+15.2% |
+12.5% |
+5.4% |
-2.7% |
$4M |
-2.0% |
+16.5% |
Source: IRI, Integrated Fresh, MULO, % growth versus year ago
Processed Meat — Growth in Three Areas, Including Powerhouse Bacon
Processed meat grew over and above the 2020 and 2019 sales levels, driven by robust bacon, packaged lunchmeat and processed chicken sales. Bacon and packaged lunchmeat are the two biggest sellers within processed meat and their gains easily offset the declines seen in dinner sausage, hot dogs and breakfast sausage.
|
July 2021 |
|
$ sales gains versus comparable period year ago |
||||||||
|
|
2019 |
Q1 ‘20 |
Q2 ‘20 |
Q3 ‘20 |
Q4 ‘20 |
Q1 ‘21 |
Q2 ‘21 |
Jul ‘21 |
Jul vs ‘20 |
Jul vs ‘19 |
|
Processed meat |
+1.9% |
+16.6% |
+22.5% |
+13.0% |
+12.8% |
+0.3% |
-7.1% |
$2.1B |
+0.3% |
+15.2% |
|
Bacon |
+2.9% |
+13.9% |
+33.0% |
+17.8% |
+19.0% |
+7.5% |
-8.9% |
$487M |
+1.0% |
+20.8% |
|
Packaged lunchmeat |
-0.6% |
+13.3% |
+11.4% |
+5.4% |
+9.8% |
-5.1% |
-4.4% |
$448M |
+0.8% |
+7.0% |
|
Dinner sausage |
+2.6% |
+21.6% |
+32.2% |
+15.9% |
+13.8% |
-3.2% |
-13.4% |
$387M |
-3.0% |
+13.9% |
|
Frankfurters |
+0.2% |
+24.0% |
+22.5% |
+15.8% |
+17.1% |
-9.9% |
-14.6% |
$270M |
-8.7% |
+4.7% |
|
Breakfast sausage |
+1.8% |
+14.3% |
+35.8% |
+20.0% |
+13.6% |
+2.3% |
-15.0% |
$143M |
-1.5% |
+17.8% |
|
Processed chicken |
+1.4% |
+16.7% |
+14.2% |
+11.2% |
+16.8% |
+5.8% |
+8.4% |
$50M |
+13.2% |
+25.2% |
|
Smoked ham |
-0.9% |
+32.7% |
30.7+% |
+17.1% |
+3.8% |
+1.3% |
-23.7% |
$52M |
-9.5% |
+14.4% |
Source: IRI, Integrated Fresh, Total US, MULO, % change vs. YA
Grinds — Growth for ground chicken
Now lapping the big spikes of 2020, only ground chicken and ground pork were able to grow sales versus year ago levels in July 2021. Ground beef, which was a top three performer all of 2020, fell 6.8% short of the July 2021 sales, but still sits 15.1% above 2019 levels.
Ground plant-based meat alternatives declined for the first time, at -4.3%, not able to keep up with their very fast rise in sales in 2020. Last year, sales were boosted by increased distribution.
|
% sales change (July 2021) versus year ago |
Dollar |
Dollar gains vs. 2020 |
Dollar gains vs. |
|
Ground beef |
$916.6M |
-6.8% |
+15.1% |
|
Ground turkey |
$104.9M |
-3.3% |
+10.9% |
|
Ground chicken |
$16.8M |
+7.0% |
+31.6% |
|
Ground pork |
$12.0M |
+0.2% |
+22.8% |
|
Ground plant-based meat alternatives |
$9.0M |
-4.3% |
+584.9% |
|
Ground lamb |
$3.2M |
-5.3% |
+24.8% |
|
Ground veal |
$0.7M |
-2.2% |
+23.0% |
Source: IRI, Integrated Fresh, Total US, MULO, % change vs. YA
Plant-Based Meat Alternatives in the Meat Dept (excluding frozen offerings)
July marks the second month in which refrigerated plant-based meat alternatives showed sales declines versus prior year as dollars dropped 3.6% versus 2020. Unlike meat, plant-based substitutes saw a small decline in the price per volume where the July average price paid per pound by shoppers dropped 0.3% versus year ago to $7.99. At the same time, more was sold on promotion. The percentage of all July dollar sales sold on promotion increased from 30.3% in July 2020 to 37.3% in July 2021, indicating a marketing effort to further drive trial.
|
Meat alternatives/substitutes dollars |
Dollar |
Dollar gains vs. 2020 |
Dollar gains vs. |
|
First half 2021 |
$249M |
+7.2% |
+133.8% |
|
Q1 2021 |
$120M |
+14.5% |
+156.5% |
|
Q2 2021 |
$128M |
+1.1% |
+115.7% |
|
July 2021 |
$41M |
-3.6% |
+85.9% |
July volume also dropped, at -3.3%. Much like the share of dollars sold on promotion, the share of volume sold while on sale also increased. In July 2020, 31.8% of plant-based meat alternative pounds were sold on promotion. In July 2021, this ratio stands at 40.4%.
|
Meat alternatives/substitutes volume |
Volume |
Lbs gains |
Lbs gains |
|
First half 2021 |
31M |
+4.8% |
+110.0% |
|
Q1 2021 |
15M |
+9.2% |
+85.4% |
|
Q2 2021 |
16M |
+0.8% |
+124.4% |
|
July 2021 |
5.1M |
-3.3% |
+79.9% |
Source: IRI, Integrated Fresh, Total US, MULO, % change vs. YA
The performance by substitute format is mixed. Meatball substitutes are still gaining, but sausage, patty and ground replacements are down.
|
July 2021 Meat alternative formats |
Dollar sales |
Change vs. 20 |
Volume |
Change vs. 20 |
|
Dinner sausage substitutes |
$11.9M |
-9.7% |
1.8M |
-7.8% |
|
Patty substitutes |
$11.3M |
-0.2% |
1.2M |
+0.6% |
|
Ground substitutes |
$9.0M |
-4.3% |
1.1M |
+0.5% |
|
Lunchmeat substitutes |
$2.3M |
+7.5% |
0.2M |
+7.5% |
|
Meatball substitutes |
$1.4M |
+71.7% |
0.2M |
+29.7% |
|
Ingredient cut substitutes |
$0.8M |
-1.1% |
0.1M |
+3.8% |
|
Breakfast sausage substitutes |
$0.3M |
-60.7% |
49K |
-57.1% |
|
Nugget substitutes |
$0.2M |
-2.8% |
13K |
-6.8% |
Source: IRI, Integrated Fresh, Total US, MULO, % change vs. YA
As of yet, most school districts are planning to resume in-person education. Consumers are expecting back-to-school spending to be big this year. The July IRI survey found that 51% of parents expect they will spend more this year than they did last year in addition to 38% believing they will spend about the same.
Of parents shopping for back-to-school items, 47% believe they will do most or all in-store and 38% expect they will spend equally in-store and online. That provides grocery retailers with an important opportunity to draw people to the store as they prepare for the upcoming school year.
Source: 210 Analytics
Looking for a reprint of this article?
From high-res PDFs to custom plaques, order your copy today!


