Meat sales volume under pressure as inflation persists in May
The height, the widespread nature and the continued acceleration of inflation dominated the U.S. headlines in May. Whether in the grocery store, at the pump or at the movies, consumers were paying more. But the focus on inflation is not limited to the media headlines. According to the May edition of the IRI monthly survey of primary shoppers, Americans are ultra-aware and many are applying lessons learned during the Great Recession to tighten spending.
- Awareness of inflation has been extremely high since early fall of 2021. The difference between then and now is the level of consumer concern about inflation and the subsequent reactions when buying groceries, which are intensifying by the month. In May, 95% of consumers were concerned over rising prices, of whom 48% were very concerned. Additionally, 92% of consumers were concerned about higher gas prices, of whom 55% were extremely worried. In contrast, only 23% of consumers had extreme concern over COVID-19 in May 2022.
- The widespread nature and height of inflation is pressuring spending for many consumers, including 38% who described their financial health as strained. Thirty percent of American households stated they struggle affording needed groceries.
- Whereas in the fall of 2021 less than 50% made changes to their grocery shopping patterns and choices, 77% of consumers chose differently when buying groceries in May. This was up another six points from the April survey when 71% of consumers bought differently. The measures to combat inflation’s impact on the grocery bill are widespread, including stocking up out of fear that items may cost more on future shopping trips (20%) or may simply not be available (16%) — further pressuring in-stock conditions. Another tactic is making a list and sticking to it, according to 39% of shoppers, which tends to impact items with an impulse nature.
- At the same time that 45% of consumers looked for sales specials, 55% said that fewer of the items they want are on sale and 42% felt that items were not discounted as much, according to the May survey. This is compounding the inflationary pressure. Creative approaches such as shorter sales and cross-category promotions could be a much-needed answer. Other popular money-saving measures included cutting back on non-essentials (36%), looking for coupons (28%), buying more private brands (24%) and buying fewer items (23%).
- Despite the high gas prices, 16% of consumers visited more stores in May than they normally do to capitalize on sales promotions or everyday low prices. An even higher 19% shopped value-focused retailers including dollar stores, ALDI, Lidl and others. Switching stores is typically one of the very last measures consumers take, but this time around, it is already in the mix. This is a telltale sign of consumers’ level of concern and true pressure on income in the light of the high gasoline prices.
- The share of home-prepared meals continued to average around 80%. Consumers would like to eat out more, but recognize home-cooked meals are cheaper. They have become more strategic in their restaurant choices and subsequent orders — opening the door for retailers to sell the sides, beverage or dessert. Restaurant takeout remained big in May, at 54% of consumers, which may also be a money-saving tactic versus eating on premise.
These measures have resulted in prolonged unit and volume pressure across most categories, while dollar sales are boosted by inflation. To document the ever-changing nature of the marketplace, IRI, 210 Analytics and Marriner Marketing continue to team up to bring the latest trends and analysis relative to meat department sales, including fresh and processed items.
Inflation insights
The price per unit across all foods and beverages in the IRI-measured multi-outlet stores, including supermarkets, club, mass, supercenter, drug and military, accelerated further to an increase of +11.8% in the five weeks ending May 29, 2022 (“May”) versus the same five weeks in 2021. Inflation was in the double digits in the center of the store (+13.7%) as well as in perishables (+11.7%) and compared to May 2019, prices across all foods and beverages were up +22.8%.
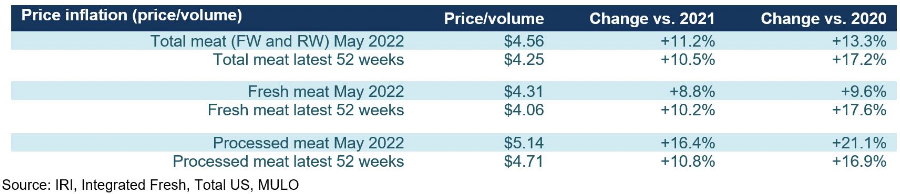
 The average price per pound in the meat department across all cuts and kinds, both fixed and random weight, stood at $4.57 in May 2022, which was up from April and versus year ago. Compared to May 2021, meat prices were up +11.2%, in line with total food and beverages. Inflation is a little milder when looking at the full 52 weeks ending May 29th, 2022, with an average price per pound of $4.25, up +10.5%. Inflation in processed meat, which had been lower than fresh meat in 2021, was much higher in May.
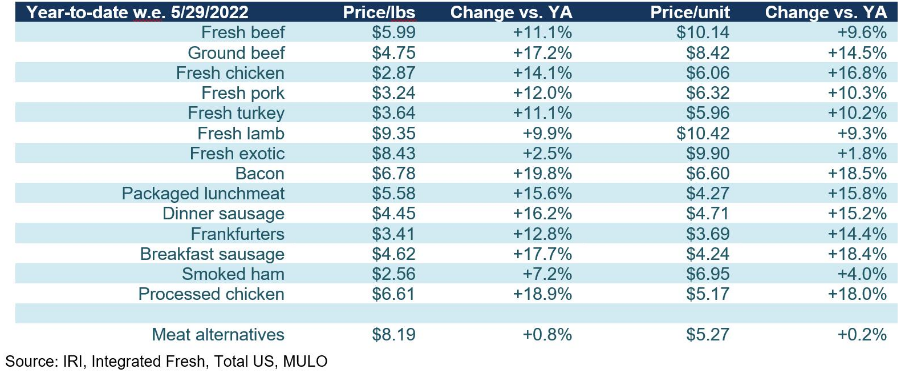
On the fresh meat side, inflation rates for the first five months of the year were a mix of single- and double-digit levels. Lamb and exotic meats such as bison had single-digit inflation year-to-date, as did smoked ham. Ground beef, bacon, breakfast sausage and dinner sausage were among the highest ones.
 Meat sales May 2022
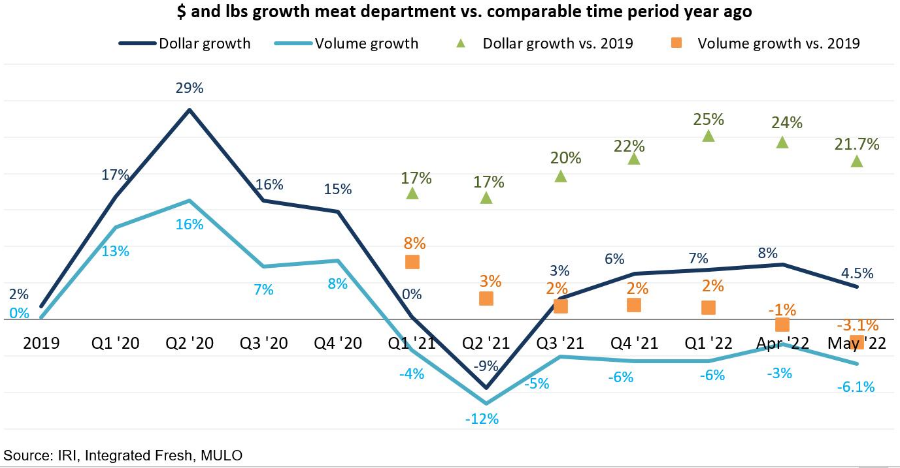
April was the first time pounds fell below 2019 pre-pandemic levels. In May, pounds dropped significantly further to -3.1% versus 2019. This indicates shoppers limited their meat purchases, in light of inflation.
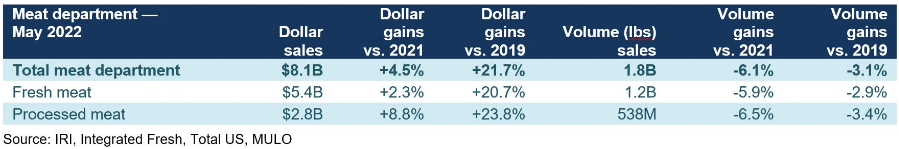
While dollar sales continued to trend at more than +20% above 2019 levels, volume has been trending down to pre-pandemic levels for a long time.
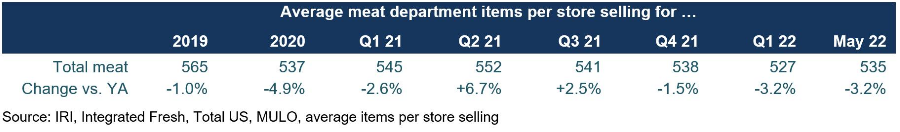
Assortment
The supply chain disruption is reflected in the average unique items in the meat department during the first quarter of 2022, in particular. Assortment recovered a little from the first quarter levels, to an average of 535 items, down -3.2% year-on-year, but still -5.9% versus pre-pandemic.
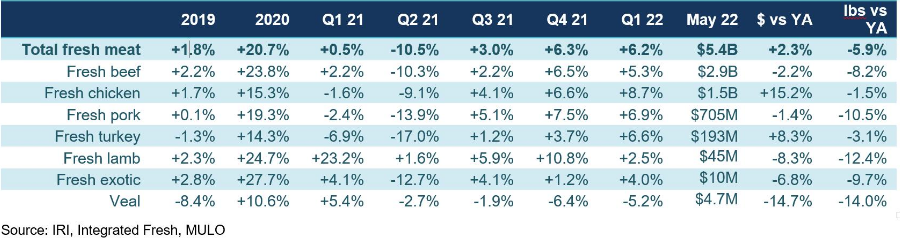
Fresh meat by protein
While the total meat department gained +2.3% in dollar sales, it was poultry that delivered the most growth. Chicken grew +15.2% in May 2022 versus year ago and turkey added +8.3%. Neither beef, nor pork, lamb, veal or exotics could reach the May 2021 dollar levels, despite the inflationary boost.
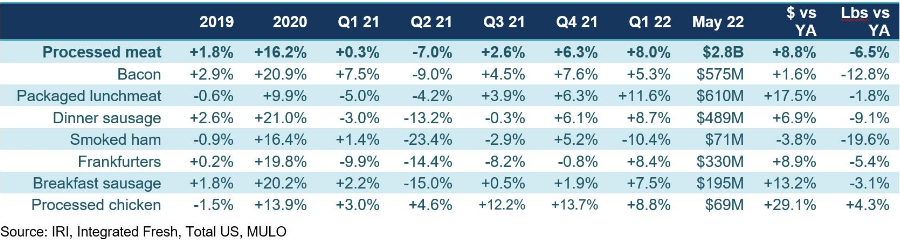
Processed meat
Processed meat dollars grew over the 2021 sales levels by +8.8% in May 2022 and the growth performance was supported by most areas except smoked ham. In pounds, however, all items were down versus year ago levels, with the one exception of processed chicken. Bacon and smoked ham in particular saw significant volume declines in May 2022 versus year ago.
Grinds
While total beef declined in dollars, ground beef grew in dollars. Turkey, chicken and pork all grew dollars as well. On the volume side, ground turkey, chicken and pork all were above or close to year ago levels, whereas ground beef lost 5.6% in pounds year-on-year. Ground beef also paced behind the pre-pandemic 2019 levels in May, whereas the other grinds all stayed ahead.

What’s next?
The war in Ukraine, the renewed COVID lockdowns in China, record inflation, labor shortages and supply chain challenges will have a continued effect on food and food sales in the months to come. Opportunities for retail remain the home-cooked meal with 90% of consumers expecting they will cook from scratch as much (74%) or more often (16%) as last year. Another opportunity is renewed in-person socializing with friends and family with 13% expecting to entertain more.
As grilling season has officially started, finding ways to tie into outdoor cooking and entertaining can be a growth opportunity.
- 69% plan to host at least one cookout or barbecue to entertain friends and family this summer, typically averaging some six to nine guests, according to the May IRI shopper survey.
- Additionally, 71% of consumers plan to grill or cook meals outdoors as much (51%) or more (20%) this summer.
- Consumers like experimenting with new items on the grill (37%) and many prefer preparing meat/seafood from scratch (74%), while 17% buy grill-ready items. Consumers are a bit more likely to buy ready-to-eat sides, at 23%.
The next performance report in the IRI, 210 Analytics and Marriner Marketing series will be released mid-July to cover the June sales trends.
Please thank the entire meat and poultry industry, from farm to store, for all they do.
Date ranges
2019: 52 weeks ending 12/28/2019
2020: 52 weeks ending 12/27/2020
Q1 2021: 13 weeks ending 3/28/2021
Q2 2021: 13 weeks ending 6/27/2021
Q3 2021: 13 weeks ending 9/26/2021
Q4 2021: 13 weeks ending 12/26/2021
Q1 2022: 13 weeks ending 3/27/2022
January 2022: 5 weeks ending 1/30/2022
February 2022: 4 weeks ending 2/27/2022
March 2022: 4 weeks ending 3/27/2022
April: 4 weeks ending 4/24/2022
May: 5 weeks ending 5/29/2022
Looking for a reprint of this article?
From high-res PDFs to custom plaques, order your copy today!


