Another record year for the meat department
Along with an increase in home-prepared meals came a drop in the share of households purchasing restaurant meals.

The year ended the way it started, with inflation taking the headlines. According to the December IRI primary shopper survey, 93% believe groceries cost somewhat or a lot more than last year and 97% are somewhat or a lot concerned about it — lower-income households in particular. Consumers are noticing higher prices for all areas of the store, but especially called out fresh areas, such as eggs, milk, produce, meat and poultry. Whether these are perceptions or reality, consumers will adjust shopping behaviors based on what they believe, which is what makes the market even more unpredictable. IRI, 210 Analytics and Marriner Marketing continue to team up to bring the latest trends and analysis relative to meat department sales, including fresh and processed items.
The IRI survey shows inflationary pressure on income is real: 43% of consumers say their current financial situation is worse than last year. Additionally, 31% expect it to be worse a year from now versus 27% who believe it will be better. This has prompted a host of money-saving measures when buying groceries among 82% of Americans, such as buying what’s on sale (53%), cutting back on non-essentials (45%), looking for coupons (35%) and switching to store brand items (31%).
The December IRI survey also noted a sharp uptick in the estimated share of meals prepared at home. The share of home-prepared meals started to rise in September and jumped from 78.9% in November to 81.5% in December. Holiday occasions as well as the recent increase in flu and COVID cases could be influencing factors.
Along with the increase in home-prepared meals came a drop in the share of households who purchased restaurant meals, from 80% in November to 76% in December. Cutting back on restaurant meals in lieu of preparing meals at home is another important cost-saving measure, according to the December IRI survey. Takeout (52%) and eating on premise (46%) were the most common ways to purchase restaurant meals, with delivery more popular among younger consumers. Lunch is one of the areas where consumers are looking to save on restaurant meals. Among away-from-home workers, 38% packed lunch more often. At the same time, 25% looked for lower-cost options and 25% for what’s on sale when deciding what to take to work for lunch. One in five away-from-home workers also reduced their spend by cutting back on snacks, treats and desserts in lunches.
Inflation insights
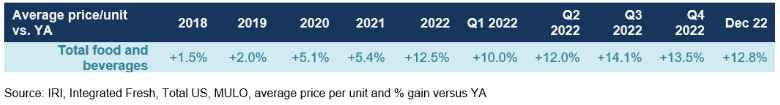
The price per unit across all foods and beverages in the IRI-measured multi-outlet stores, including supermarkets, club, mass, supercenter, drug and military, increased 12.8% in December (the four weeks ending 12/25/2022). The fourth quarter inflation averaged 13.5% per unit, which was down about a half point from the third quarter. Compared with December 2019, prices across all foods and beverages were up 27.5%.
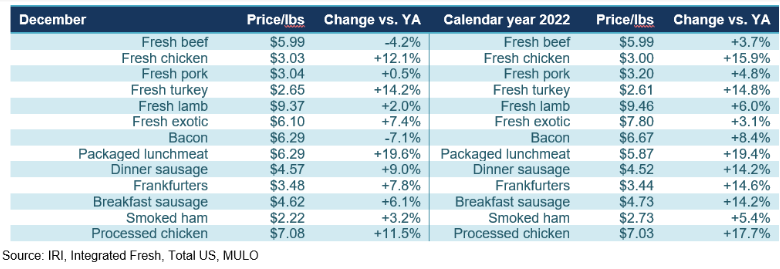
The average price per pound in the meat department across all cuts and kinds, both fixed and random weight, stood at $4.31 in December 2022, which was less than the annual 2022 average, at $4.42. This is likely influenced by the various holiday promotions as well as the moderation of meat inflation seen since the third quarter of 2022.
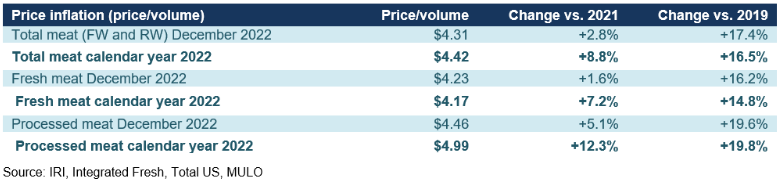
By protein, the moderation in price increases is driven by beef, pork, lamb and bacon in December. On the other hand, both chicken and turkey continued to experience double-digit inflation in December, though the increases are moderating here as well. For all of 2022, packaged lunchmeat had the highest increases of all, at +19.4% over 2021 levels. Several others had double digit inflation, including chicken, turkey and all processed meat items with the one exception of smoked ham.
Meat sales December 2022
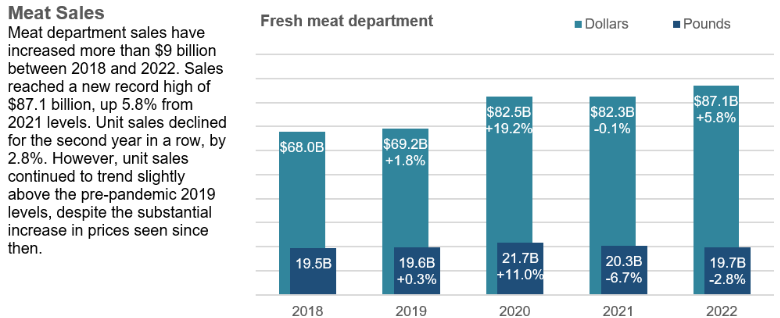
December was a very strong month for the meat department with sales increases for dollars and pounds. Additionally, pound sales jumped more than 3% ahead of the pre-pandemic normal of 2019.
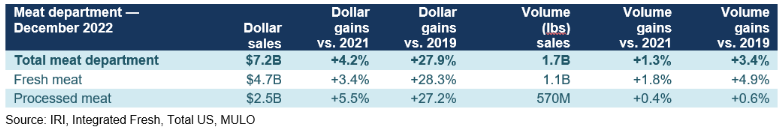
The strong December results pulled up the fourth quarter dollar sales results to an increase of 3.8% over the third quarter of 2021. Third quarter volume sales were stronger than those seen in the second and third quarter — increasing 1.1% over 2021 levels.
 Assortment
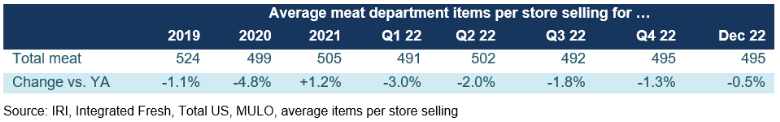
Assortment is averaging 495 items, which is around 2020 levels, and down about 0.5% year-on-year and 5.1% versus 2019. The decline has been driven by processed meat throughout the year.
Fresh meat by protein
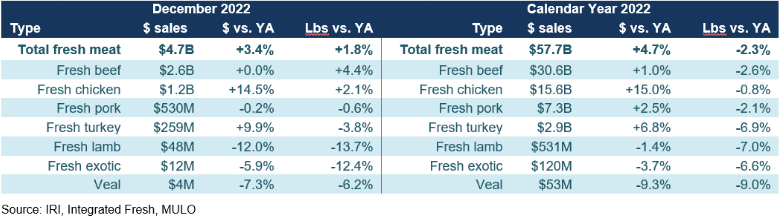
Beef and chicken were the big contributors to December fresh meat sales, that totaled $4.7 billion. Chicken experienced an uptick in pounds and dollars in December and came very close to 2021 volume levels in the full calendar year. In all, fresh meat sales increased 4.7% in 2022.
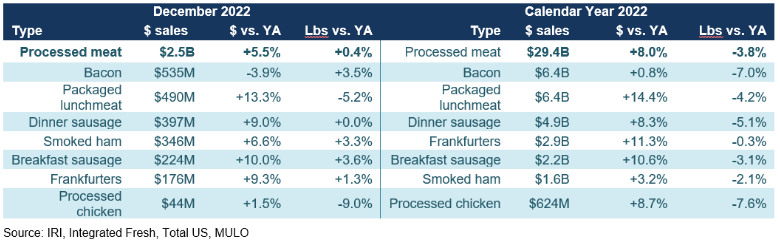
Processed meat
December was also a strong month for processed meat, with several areas moving into positive pound territory, including powerhouse seller, bacon, and seasonal favorite, smoked ham. For the full calendar year, all areas experienced some pressure on volume, but dollars were universally up due to the effects of inflation.
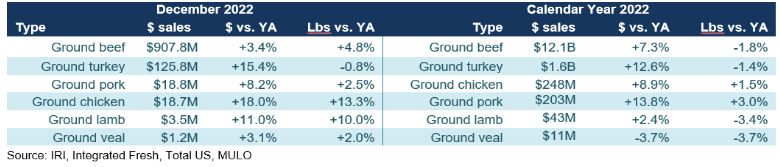
Grinds
Grinds generated $1.1 billion in the four December weeks, with 84% of dollars and pounds being generated by ground beef. Despite being a massive seller, ground beef pound sales increased by 4.8% in December and it was the first month when ground pork sales edged ahead of ground chicken sales. For the full calendar year, grinds totaled $14 billion with pound gains for both chicken and pork.
What’s next?
The first quarter of 2023 will pick up where 2022 left off. Inflation is likely to start moderating month-over-month like we have been seeing in the fourth quarter of 2021, though weather and transportation conditions remain unknowns. With it, units and volume are creeping closer to year ago levels while dollars remain elevated as a result of higher retail prices.
The next performance report in the IRI and 210 Analytics will be released mid-February 2023 to cover the January sales trends.
Please thank the entire meat and poultry industry, from farm to store, for all they do.
Date ranges:
2019: 52 weeks ending 12/28/2019
2020: 52 weeks ending 12/27/2020
2021: 52 weeks ending 12/26/2021
2022: 52 weeks ending 12/25/2022
Q1 2022: 13 weeks ending 3/27/2022
Q2 2022: 13 weeks ending 6/26/2022
Q3 2022: 13 weeks ending 9/25/2022
Q4 2022: 13 weeks ending 12/25/2022
December 2022: 4 weeks ending 12/25/2022
Note: The October data reflects a substantial data restatement across all areas of the store. 2019-Q3 2022 reflect the prior data universe.
Looking for a reprint of this article?
From high-res PDFs to custom plaques, order your copy today!


