Protein by the Numbers
The Organic Consumer, 2016 vs. 2006
Since the mid-1900s, The Hartman Group has been at the leading edge of tracking the evolution of U.S. consumers through their ever-expanding exploration of organic categories. During that time, the consumer meaning and perceived value of organic have evolved, along with the users of organics themselves. Here are some ways consumers' participation and perceptions have changed between 2006 and 2016.
Organic Participation Continues to Grow
Looking across ten years, there has been growth in all levels of organic participation.
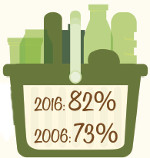
How Many Consumers Use Organic Foods or Beverages?
(Based on Past 3 Months Organic Food and Beverage Usage)
- 2006: 73% | 2016: 82%
How Often Have Consumers Used Organic Foods or Beverages in the Past 3 Months?
2006 | 2016
- Daily: 9% | 10%
- Weekly: 14% | 18%
- Monthly: 6% | 10%
- Occasionally: 44% | 44%
- Never: 27% | 18 %
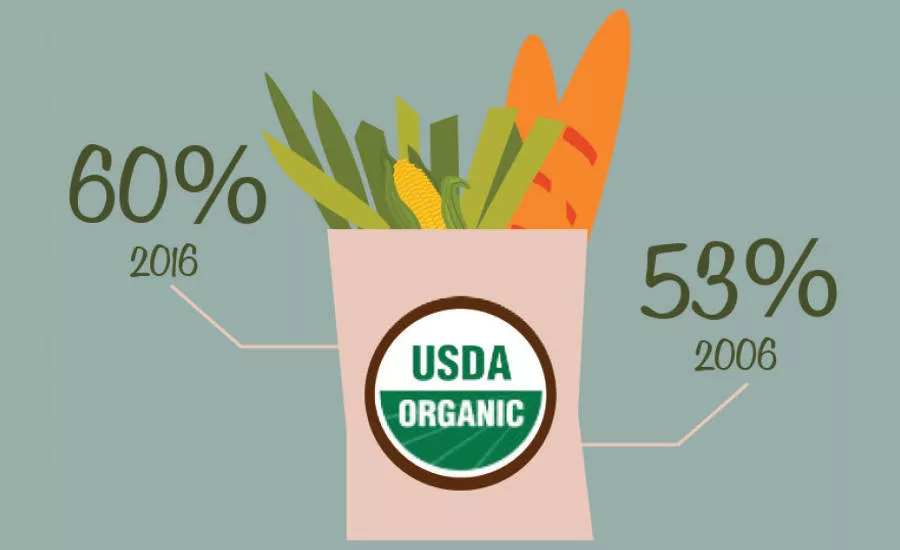
Consumer Awareness of Regulatory Procedures
Percentage of consumers aware that there are governmental standards regulating the use of the organic label on foods and beverages:
- 2006: 53% | 2016: 60%
Primary Reasons for Buying Organic Food and Beverages
(By Organic Purchasers)
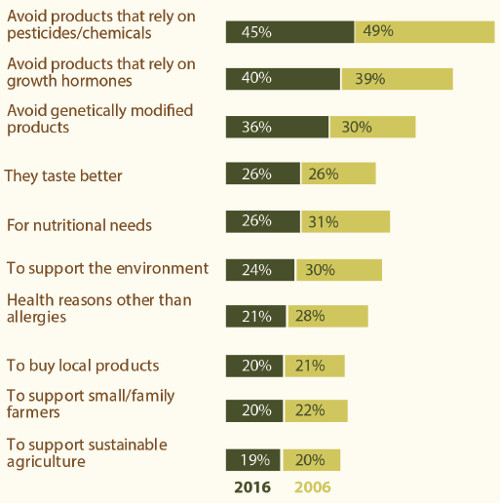
Source: Organic & Natural 2016 report
©2017 The Hartman Group, Inc. All rights reserved.
hartman-group.com
![]()
Looking for a reprint of this article?
From high-res PDFs to custom plaques, order your copy today!


-(780-%C3%97-439-px)-(780-%C3%97-439-px)-(14).webp?height=200&t=1665457266&width=200 "CHi Foods Italian Herb pork alternative")