Meat reaches 24th week of double-digit gains; claims-based has grown 32%+
Following the two massive stock-up weeks in mid-March, trip frequency fell while the basket size rose. Even though spending has been highly elevated, trips remained right around last year’s levels for the subsequent five months as shoppers focused on one trip, one store for their weekly needs. Wave 17 of the IRI COVID-19 shopper impact survey, conducted between August 7 and 9, reveals there are finally some signs of easing for the stock-up trip behavior. Down from 41% in early July, 34% of shoppers say they remain focused on making fewer, larger groceries trips to minimize in-store visits. And down from 30%, now only 25% are stocking up on pantry staples/essentials more than usual. These changes go hand-in-hand with concerns over COVID-19 easing a bit, although 57% of the population remain extremely concerned down from a high of 60% in late June. New COVID-19 cases are moderating in most parts of the country.
Meanwhile, more districts have firmed up back-to-school plans. The percentage of parents who say their children will follow online, at-home education reached yet another high during wave 17 of the IRI survey. Nearly 60% of parents with children ages six to 12 reported their children will follow at-home education only, with an additional 17% reporting the kids will follow a hybrid online and in-person format. Among parents with students ages 13 to 17, 52% reported their children will partake in virtual education only, with an additional 20% in the hybrid system. This is likely to affect trend lines of items popular for the breakfast, snack and lunch occasions.
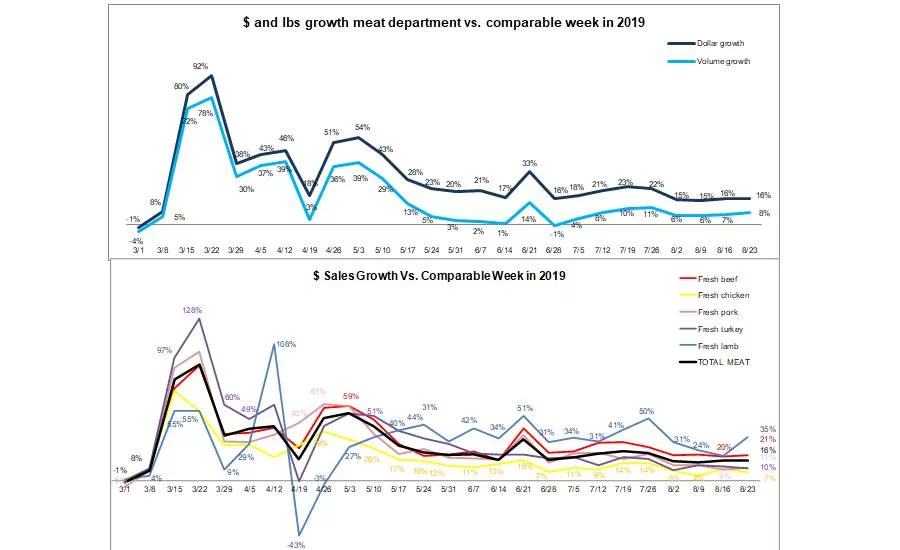
The net effect of these negative and positive forces resulted in continued high everyday demand for the meat department the third full week of August. This was the seventh of eight non-holiday weeks between Independence Day and Labor Day. Total meat sales reached its 24th week of double-digit dollar gains during the week ending August 23, at +16.2% — virtually unchanged from the week prior. With prices continuing to drop in favor of the consumer, volume sales increased 7.9% over last year’s levels. At an average of $3.80 per volume across all meats during the week of August 23, prices dropped 1.4% versus the week prior. Fresh meat prices dropped even more, at -1.8% versus a slight increase of +0.2% for processed meats.
So far during the pandemic, starting March 15 through August 23, dollar sales are up 31.7% and volume sales have increased 19.1% versus the same period last year. This translates into an additional $8.6 billion in meat department sales during the pandemic, which includes an additional $4.0 billion for beef, $1.2 billion for chicken and $893 million for pork. The week of August 23rd had 15.5 million more transactions compared to same week year ago and 898 million more transactions year-over-year since the pandemic began. Transactions have been on an uptick the last two weeks as promotions increase with prices far more attractive than those seen in the past few months.
Dollar versus Volume Gains
The gap between dollar gains and volume gains narrowed to 8.3 percentage points — its smallest gap since mid April. At its widest point, the growth gap between volume and dollar gains was 19.1 percentage points during the week of June 21st. Processed meats had a very strong performance this week, up 19.4% —four points higher than fresh meat. Volume gains were much stronger as well.
| Latest 1 week ending August 23, 2020 versus comparable week in 2019 | Dollar gains | Volume gains |
Volume/dollar gap (percentage points) |
| Total meat | +16.2% | +7.9% | -8.3 |
| Total fresh | +15.3% | +7.2% | -8.1 |
| Total processed | +19.4% | +10.5% | -8.9 |
Source: IRI, Total US, MULO, 1 week % gain versus YA
The volume/dollar gap in the longer, four-week look dropped and is now well below the 10-point mark. For the four weeks ending August 23, the gap narrowed from 9.7 percentage points to 9.1 points — signaling average retail prices continued to come down. The longer view shows double digit gaps for frankfurters, beef and lamb, whereas pork and turkey are in the low single digits. Fresh exotic meats, including bison, is the only area that saw volume gains trending ahead of dollars, creating a positive gap, at +3.1 points. In the one-week look, most meats now have single digit gaps, with the exception of lamb and frankfurters.
| Latest 4 weeks ending August 23, 2020 versus comparable weeks in 2019 | 4-week dollar gains | 4-week volume gains | 4 week volume/dollar gap (points) | 1 week volume/dollar gap (points) |
| Total meat | +15.8% | +6.7% | -9.1 | -8.3 |
| Fresh beef | +20.4% | +10.4% | -10.0 | -8.1 |
| Ground beef | +11.5% | +2.9% | -8.6 | -5.4 |
| Fresh chicken | +7.4% | +1.7% | -5.7 | -3.3 |
| Fresh pork | +11.1% | +7.5% | -3.6 | -7.4 |
| Fresh turkey | +10.6% | +7.3% | -3.3 | -5.1 |
| Fresh lamb | +27.1% | +16.5% | -10.6 | -13.5 |
| Fresh exotic | +30.6% | +33.7% | +3.1 | +2.3 |
| Fresh veal | +13.5% | +12.2% | -1.3 | -4.9 |
| Smoked ham/pork | +16.8% | +12.0% | -4.8 | -5.5 |
| Sausage | +16.8% | +9.6% | -7.2 | -82 |
| Frankfurters | +15.4% | +0.8% | -14.6 | -12.6 |
| Bacon | +18.1% | +10.7% | -7.4 | -6.3 |
Source: IRI, Total US, MULO, 4 weeks ending August 23, 2020 versus YA
Assortment
The slow and steady comeback in the number of items stalled out this week, at an average of 324 items per store selling. This is down about 14 items from prior year levels — a vast improvement from May and June levels.
| Average weekly items per store selling for week ending… | ||||||
| March (3/1-3/29) | April (4/5-4/26) | May (5/3-5/31) | June (6/7-6/28) | July (7/5-7/26) | 8/16 | 8/23 |
| 332 | 315 | 301 | 304 | 317 | 324 | 324 |
Source: IRI, Total US, MULO, average weekly items per store selling
Supply expert Christine McCracken, Executive Director Food & Agribusiness for Rabobank, provides an update on the supply and assortment landscape. “After weeks of trailing year-ago production, chicken production rose 2.1% above year-ago on a return to heavier bird weights. Cattle slaughter is also back to year-earlier levels, while the hog harvest is nearly 8% ahead of last year as the industry continues to work through the backlog of production. Labor challenges in the processing plants remain an issue, especially in the pork and poultry industries. Reports, late in the week, that a California poultry plant may be forced to close on rising cases of COVID-19 among its workforce are being watched closely by other processors, especially those facing ongoing issues of high absenteeism. The net result has been to limit supplies of deboned product. Even with large overall supplies of chicken, we continue to see modest premiums for boneless breast and thigh meat being paid. The same is true for boneless hams.”
Price
IRI insights on the price per volume shows prices were still elevated the third week of August versus 2019 levels. The year-over-year comparison shows that chicken and turkey prices were closest to 2019 levels. Now well ahead of beef, lamb prices were the most elevated versus year ago, at +11.2%. In the longer four-week look, beef’s year-over-year prices dropped to single digits, including ground beef prices.
|
Average price per volume versus the same period year ago |
1 week ending August 23 | 4 weeks ending August 23 | |||
| Average | Change vs. prior period |
Change vs. YA |
Average | Change vs. year ago | |
| Total meat (fresh + processed) | $3.80 | -1.4% | +7.7% | $3.84 | +8.5% |
| Fresh beef | $5.33 | -1.3% | +7.2% | $5.43 | +9.1% |
| Ground beef | $4.03 | -1.4% | +5.1% | $4.13 | +8.3% |
| Fresh chicken | $2.42 | -2.2% | +3.2% | $2.45 | +5.6% |
| Fresh pork | $2.82 | -1.4% | +7.1% | $2.79 | +3.4% |
| Fresh turkey | $3.43 | 0.0% | +4.8% | $3.39 | +3.1% |
| Fresh lamb | $8.72 | +1.8% | +11.2% | $8.57 | +9.1% |
| Fresh exotic | $4.32 | +1.2% | -1.7% | $4.27 | -2.3% |
Source: IRI, Total US, MULO, 1 week and 4 weeks ending August 23, 2020
McCracken added insight on prices and demand for the upcoming weeks. “Buyer interest in chicken has waned in these final weeks of summer, with the possible exception of wings. Support for chicken wings from traditional and new wing takeout concepts, given the ease of preparation, is helping to support prices heading into the fall. I expect to see retail support for beef, especially ribs and loins over the Labor Day holiday. With ample supplies of protein, consumers should have plenty of low-cost options. Export markets for chicken remain weak, with ongoing disruption in key markets like Cuba, Angola and even Mexico limiting interest. Dark meat supplies continue to overwhelm the export markets, pressuring prices for thigh meat that are down 48% versus year-ago, and drums. Pork exports have strengthened in recent weeks, with shipments to China up over 40% versus year ago and sales to Mexico stronger (up over 20% year-over-year) for much of August. With over 30% of U.S. pork sold into foreign markets, exports remain a key driver of pork values.
Meat Gains by Protein
Four out of the five fresh proteins had double-digit gains during the week ending August 23 versus year ago. Pork gains once more exceeded those of chicken and lamb took over as the highest growth area, percentage wise.
The Pandemic Sales Performance by Area
Meat department sales were $1.26 billion during the week of August 23 — about $38 million lower than the week prior. In other words, sales over the prior periods were off 2.9%, even if year-over-year sales were a little higher than they were the week of August 16. Lamb had the strongest gains, followed by exotic meats Beef accounted for 51.3% of the $176 million in new meat department dollars this week, punching above its weight with a sales share of 42.1%. At +$90.4 million, beef’s additional dollars were more than five times that of chicken the week of August 23, that generated +$16.4 million. Pork added the third most new dollars this week, at +$11.8 million.
| 2020 Weekly $ sales gains versus comparable 2019 week ending… | $ | ||||||||||
| 3/1 |
March (3/8-3/29) |
April (4/5-4/26) |
May (5/3-5/31) | June (6/7-6/28) | July (7/5-7/26) | 8/16 | 8/23 | 8/23 | |||
| TOTAL MEAT | -1% | +54% | +38% | +32% | +22% | +21% | +16.1% | +16.2% | $1.26B | ||
| Fresh | |||||||||||
| Beef | 0% | +53% | +42% | +36% | +27% | +28% | +19.5% | +20.5% | $531M | ||
| Chicken | +1% | +41% | +32% | +21% | +13% | +12% | +9.6% | +7.2% | $242M | ||
| Pork | -5% | +56% | +44% | +32% | +24% | +21% | +8.9% | +10.6% | $123M | ||
| Turkey | 0% | +72% | +36% | +43% | +23% | +17% | +11.2% | +10.0% | $37M | ||
| Lamb | +1% | +34% | +8% | +36% | +39% | +39% | +19.8% | +34.6% | $9M | ||
| Exotic | +5% | +92% | +54% | +61% | +48% | +36% | +32.7% | +28.4% | $3M | ||
| Processed | |||||||||||
| Smoked ham/pork | -6% | +118% | +20% | +63% | +35% | +26% | +15.8% | +15.7% | $15M | ||
| Sausage | 0% | +63% | +42% | +35% | +24% | +17% | +18.5% | +18.9% | $120M | ||
| Frankfurters | -1% | +76% | +39% | +20% | +17% | +14% | +19.1% | +18.6% | $56M | ||
| Bacon | -6% | +54% | +48% | +34% | +18% | +19% | +19.6% | +20.7% | $112M | ||
Source: IRI, Total US, MULO, 1 week % change vs. YA
Grinds
Ground beef volume growth for week ending August 23 was +7.2% and fueled by increased promotional activity. The average promotional price was $3.50, which is just $0.12 higher than the same week last year.
- Ground beef increased 12.7% in dollars and volume reached its highest point since the end of July, at +7.2%
- Ground turkey, +7.2% in dollars and +3.4% in volume
- Ground chicken, +17.3% in dollars and +9.6% in volume
- Ground pork, +12.3% in dollars and +6.0% in volume
Combined, these four ground proteins generated $231 million in sales, down from $237 million the week prior. Ground beef represented 89.8% of additional year-over-year grind dollars.
Market Shifts
Beef has been an astounding pandemic powerhouse with continued elevated dollar and volume shares compared with their March 1, pre-pandemic start. Pork had significantly higher shares a few months ago, but is mostly back in line with prior levels. Chicken remains down in both dollar and volume share.
| Share of dollar sales | Share of volume sales | |||||
| Week ending 3/1 | Week ending 8/23 | Building calendar year 2019 | Building calendar year 2020 |
Week ending 3/1 |
Week ending 8/23 |
|
| Beef | 53.3% | 56.1% | 54.2% | 55.6% | 37.0% | 38.9% |
| Chicken | 27.5% | 25.6% | 26.8% | 25.4% | 40.5% | 39.1% |
| Pork | 12.9% | 13.0% | 13.5% | 13.5% | 16.5% | 17.0% |
| Turkey | 4.4% | 3.9% | 4.2% | 4.2% | 4.8% | 4.2% |
| Lamb | 0.9% | 0.9% | 0.9% | 0.9% | 0.4% | 0.4% |
| Veal | 0.1% | 0.1% | 0.1% | 0.1% | 0.1% | <0.1% |
| Exotic | 0.3% | 0.3% | 0.3% | 0.3% | 0.2% | 0.2% |
Source: IRI, Total US, MULO, % of total meat department dollars | “All other” not reflected
Claims-based meat
Much like value-added, claims-based meat availability was spotty at times, which would have affected purchase ability. However, antibiotic-related claims, organic and grass-fed claims saw unprecedented growth rates. During the March through July pandemic period, claims-based meat gained 31.9% in dollars. The highest gains were reserved for grass-fed beef, at +64.3%. Beef also led growth percentages in organic, +57.9% and antibiotic-related claims, at +60.6%. Chicken, which lost some market share amid the pandemic, also saw some softness in antibiotic-free claim sales, which led to a drop in share.
| Claims-based meat and poultry | 52-week $ growth w.e. 2/23/20 share of total meat | 52-week $ growth w.e. 2/23/20 | Pandemic share of total meat | Pandemic $ growth |
| Total | 18.2% | +3.6% | 17.6% | +31.9% |
| Organic | 2.1% | +5.7% | 2.1% | +35.8% |
| Antibiotic claims | 13.2% | +3.2% | 12.5% | +30.9% |
| Grass-fed | 2.6% | +1.2% | 1.4% | +64.3% |
Source: IRI, U.S. MULO, fixed and random weight, March 15-July 12, 2020 versus YAGO
What’s Next?
The week of August 23rd was the next to last in a series of eight weeks where everyday demand is responsible for pushing sales above last year’s levels. Labor Day is typically a big at-home holiday already and may not see the types of gains seen for Mother’s Day or Father’s day. However, prices are a lot more favorable than those seen during Independence Day and Memorial Day, which may help fuel volume demand. Restaurant transactions continue to recover but remain below last year’s levels.
Both consumer concern and economic pressure remain high, but stable for the moment. Aided by the effect of virtual schooling, meat sales are likely to hold well above 2019 levels for the foreseeable future.
Source: 210 Analytics/IRI
Looking for a reprint of this article?
From high-res PDFs to custom plaques, order your copy today!