Father’s Day weekend provided a huge boost to meat sales
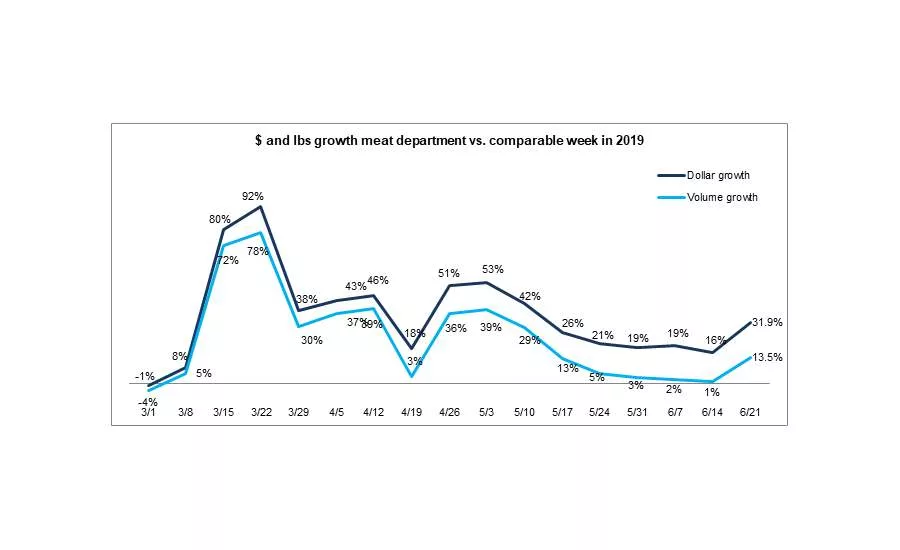
The week ending June 21st was Father’s Day weekend and the results for the meat department as a whole, and beef in particular, were astounding. In 2019, Father’s Day fell a week earlier and provided a 5% boost in spending versus 2018. The weeks leading up to the 2020 Father’s Day week were plagued with supply chain tightness and purchasing limits. However, the week of Father’s Day, the meat department had much improved its in-stock position, the widest assortment seen in weeks and purchase limitations were more the exception than the rule. However, prices remained highly elevated and that was the big unknown relative to the success of Father’s Day 2020. The second unknown was consumer engagement with foodservice, with restaurants in most parts of the country reopened, albeit with social distancing measures in place.
Despite prices and restaurant competition, the Father’s Day sales bump was much higher than the year prior, with sales gains for the week of June 21 of 31.9%. This marks the 15th week of double-digit gains since the onset of the pandemic. Much like Mother’s Day and Memorial Day, this shows a disproportionate bump for retail meat sales for the spring and summer holidays thus far.
Volume demand also saw a robust rebound and jumped 13.5% ahead of the same week last year. This was the highest volume gain since the second week of May. Despite this increase, the gap between dollar gains and volume growth sat a new record, at 18.4 percentage points. In part, Father’s Day spending may have driven the purchase of higher end items, as evidenced by the high dollar share of beef. But above all, prices remained highly elevated from the year prior.
Year-to-date through June 21, meat department dollar sales were up 24.4%, boasting double-digit growth for the months of March, April and May. This reflects an additional $6.9 billion sold versus the same time period in 2019. Year-to-date volume sales through June 21 were up 15.6% over the same period in 2019, reflecting an additional 1.28 billion pounds of meat and poultry sold versus the same time period in 2019.
Dollar versus Volume Gains
During the third week of June, the gap between volume and dollar sales increased 3.4 points versus the week prior. However, volume sales were for beef and pork were positive versus declines in the prior week. Pork, in particular, recorded a huge swing from -3.6% the week of June 14 to +26.9% Father’s Day week. Volume gains for the other proteins were in double-digits, led by the smaller proteins, including lamb and exotic.
|
Latest 1 week ending June 21, 2020 versus comparable week in 2019 |
Dollar gains |
Volume gains |
Volume/dollar gap |
|
Total meat |
+31.9% |
+13.5% |
-18.4 |
|
Fresh beef |
+41.6% |
+8.3% |
-33.3 |
|
Ground beef |
+32.2% |
+1.6% |
-30.6 |
|
Fresh chicken |
+16.1% |
+10.1% |
-6.0 |
|
Fresh pork |
+36.2% |
+26.9% |
-9.3 |
|
Fresh turkey |
+20.6% |
+17.0% |
-3.6 |
|
Fresh lamb |
+51.3% |
+43.7% |
-7.6 |
|
Fresh exotic |
+43.4% |
+43.2% |
-0.2 |
Source: IRI, Total US, MULO, 1 week % gain versus YA
The longer, four-week look ending June 21 also shows double-digit volume/dollar gaps for fresh beef and pork, that in turn caused a double-digit volume/dollar gap for total meat. Exotic meat, which includes proteins like bison, show higher volume than dollar gains over the four week look. This is a clear sign that at least some consumers are shopping other proteins amid the high beef and pork prices.
|
Latest 4 weeks ending June 21, 2020 versus comparable weeks in 2019 |
Dollar gains |
Volume gains |
Volume/dollar gap |
|
Total meat |
+21.7% |
+5.0% |
-16.7 |
|
Fresh beef |
+25.5% |
-2.8% |
-28.3 |
|
Ground beef |
+26.5% |
-3.7% |
-30.2 |
|
Fresh chicken |
+13.0% |
+5.9% |
-7.1 |
|
Fresh pork |
+23.6% |
+6.6% |
-17.0 |
|
Fresh turkey |
+22.7% |
+21.0% |
-1.7 |
|
Fresh lamb |
+39.1% |
+32.4% |
-6.7 |
|
Fresh exotic |
+40.7% |
+42.1% |
+1.4 |
|
Fresh veal |
+19.8% |
+17.5% |
-2.3 |
|
Smoked ham/pork |
+34.6% |
+30.7% |
-3.9 |
|
Sausage |
+24.0% |
+15.5% |
-8.5 |
|
Frankfurters |
+16.7% |
+0.6% |
-16.1 |
|
Bacon |
+17.8% |
+6.3% |
-11.5 |
Source: IRI, Total US, MULO, 4 weeks ending June 21, 2020 versus YA
Assortment
Consumer comments on the Retail Feedback Group Constant Customer Feedback system contained many fewer comments on meat out-of-stocks and inventory. “Meat and poultry were well stocked this time, though there was no ground beef except for organic or the expensive ground beef.” Another commented, “No more purchase limits which was nice to see as I had planned to make steaks to celebrate Father’s Day. The quantity of the meat did not seem to match the price being asked to pay though and there was no chicken to be found.”
IRI’s measure reflecting the average number of items sold per store indeed showed improvement to 311 — its highest level since the week ending April 19. While a vast improvement, this still reflects 31 fewer items than the same week last year.
|
Average weekly items per store selling for week ending… |
|||||||||
|
3/1 |
3/8 |
3/15 |
3/22 |
3/29 |
April (4/5-4/26) |
May (5/3-5/31) |
6/7 |
6/14 |
6/21 |
|
335 |
334 |
353 |
330 |
308 |
315 |
301 |
300 |
305 |
311 |
Source: IRI, Total US, MULO, average weekly items per store selling
According to the wave 13 results of the IRI consumer sentiment survey, 20% of consumers ran into out of stocks when looking to purchase meat and/or poultry Father’s Day week. Instead of their intended meat/poultry purchase, 38% used the meat/poultry they already had stored in the freezer, 31% bought a different type of meat instead, 24% went back to the same retailer another day to buy it and 23% instead went to another retailer to buy the meat/poultry they had intended to buy. Additionally, 57% of those who bought seafood said they did so because of limited meat availability. These statistics clearly underscore the impact out-of-stocks can have, from losing a purchase to another type, brand or retailer to losing out on the purchase altogether.
While assortment improved, consumers continued to call out higher meat prices and fewer meat features on CCF. “The prices are getting out of hand for meat.” Another shopper said, “Some prices have increased to the point that I will not buy the items.” IRI’s insights on the average retail price per volume show significant upward year-over-year pressure on retail prices for the week ending June 21 for beef, particularly ground beef. Pork prices, that were up double digits in the four week look, are down nearly 10% from the week prior Father’s Day week. Additionally, the difference with the same week last year has much diminished and is now in the single digits, at +7.3%. Beef prices were still much higher the third week of June, though ground beef prices had moderated somewhat. Exotic meats are the only ones to be stable in the shorter-term and actually show a bit of a price decline in the four-week look.
|
Average price per volume |
1 week ending June 21 |
4 weeks ending June 21 |
|||
|
|
Average |
Change vs. prior period |
Change |
Average |
Change vs. year ago |
|
Total meat |
$4.16 |
+0.6% |
+16.1% |
$4.10 |
+15.9% |
|
Fresh beef |
$6.54 |
+1.9% |
+30.7% |
$6.46 |
+29.1% |
|
Ground beef |
$4.94 |
-1.9% |
+30.1% |
$5.00 |
+31.4% |
|
Fresh chicken |
$2.46 |
-0.4% |
+5.4% |
$2.45 |
+6.7% |
|
Fresh pork |
$3.02 |
-9.6% |
+7.3% |
$3.18 |
+15.9% |
|
Fresh turkey |
$3.38 |
+1.3% |
+3.1% |
$3.36 |
+1.3% |
|
Fresh lamb |
$8.50 |
+0.4% |
+5.3% |
$8.39 |
+5.1% |
|
Fresh exotic |
$4.34 |
+1.7% |
+0.1% |
$4.33 |
-1.0% |
Source: IRI, Total US, MULO, 1 week and 4 weeks ending June 14, 2020
Meat Gains by Protein
The overall 31.9% meat department gain was fueled by double-digit gains for all proteins. The two smaller proteins, turkey (+20.6%) and lamb (+51.3%), had the highest percentage gains versus year ago, but beef easily had the highest absolute dollar gains (+$192 million), followed by pork (+$43 million) and chicken (+$36 million). Exotic meat sales gained just under $1 million or 43.4% versus the same week year ago.
Grinds
Ground beef sales improved versus the week prior and gained 32.2% versus the same week in 2019. However, much of this gain was driven by higher prices. Ground beef volume sales did turn positive again Father’s Day week, at +1.6% versus year ago. While ground beef held its ground, some consumers continued to substitute with other grinds, including ground turkey, chicken, pork and exotic meats, such as bison. These all saw high double-digit gains in both dollars and volume.
- Ground beef increased 32.2% in dollars but was up 1.6% in volume.
- Ground turkey, +16.4% in dollars and +11.7% in volume.
- Ground chicken, +24.7% in dollars and +20.4% in volume
- Ground pork, +22.5% in dollars and +16.6% in volume.
For the week ending June 21 versus year ago, these four ground proteins generated $274 million in sales, which represents an additional $64 million versus year ago.
The Pandemic Sales Performance by Area
Total meat department sales came in at $1.48 billion for the week of June 21. Growth percentages for most of the proteins jumped back up Father’s Day weekend after tapering off for weeks. Beef and pork, in particular, did extremely well. Smaller proteins, including lamb and exotic, also saw a significant improvement over the week prior, whereas chicken and turkey were more in line with the gains seen the week of June 14.
|
|
|
2020 Weekly $ sales gains versus comparable 2019 week ending… |
$ |
|||||
|
|
3/1 |
March |
April |
May (5/3-5/31) |
6/7 |
6/14 |
6/21 |
6/21 |
|
TOTAL MEAT |
-1% |
+54% |
+38% |
+32% |
+19.4% |
+15.9% |
+31.9% |
$1.5B |
|
Fresh |
|
|
|
|
|
|
|
|
|
Beef |
0% |
+53% |
+42% |
+36% |
+23.3% |
+16.1% |
+41.6% |
$654M |
|
Chicken |
+1% |
+41% |
+32% |
+21% |
+10.9% |
+13.4% |
+16.1% |
$259M |
|
Pork |
-5% |
+56% |
+44% |
+32% |
+17.9% |
+16.9% |
+36.2% |
$162M |
|
Turkey |
0% |
+72% |
+36% |
+43% |
+21.7% |
+20.9% |
+20.6% |
$39M |
|
Lamb |
+1% |
+34% |
+8% |
+36% |
+41.5% |
+33.5% |
+51.3% |
$10M |
|
Exotic |
+5% |
+92% |
+54% |
+61% |
+45.2% |
+35.8% |
+43.4% |
$3M |
|
Processed |
|
|
|
|
|
|
|
|
|
Smoked ham/pork |
-6% |
+118% |
+20% |
+63% |
+33.0% |
+29.6% |
+36.3% |
$16M |
|
Sausage |
0% |
+63% |
+42% |
+35% |
+21.8% |
+17.6% |
+32.2% |
$136M |
|
Frankfurters |
-1% |
+76% |
+39% |
+20% |
+17.0% |
+14.3% |
+25.0% |
$69M |
|
Bacon |
-6% |
+54% |
+48% |
+34% |
+18.8% |
+12.9% |
+21.6% |
$117M |
Source: IRI, Total US, MULO, 1 week % change vs. YA
Market Shifts
The strong Father’s Day beef sales prompted the beef share of total dollars for the week ending June 21 to jump to 58% versus 53.3% the first week of March. Year-to-date, the dollar shares for beef, pork and turkey are higher than the same period in 2019. Pork also saw its share of volume rise, but beef’s volume share is down nearly one point. Chicken’s dollar share has been down but its volume share increased.
|
Share of dollar sales |
Share of volume sales |
|||||
|
|
Week ending 3/1 |
Week ending 6/21 |
Building calendar year 2019 |
Building calendar year 2020 |
Week ending |
Week ending |
|
Beef |
53.3% |
58.0% |
51.2% |
55.3% |
37.0% |
% |
|
Chicken |
27.5% |
23.0% |
26.8% |
25.5% |
40.5% |
% |
|
Pork |
12.9% |
14.3% |
13.4% |
13.6% |
16.5% |
% |
|
Turkey |
4.4% |
3.5% |
4.3% |
4.4% |
4.8% |
% |
|
Lamb |
0.9% |
0.9% |
0.9% |
0.9% |
0.4% |
% |
|
Veal |
0.1% |
0.1% |
0.1% |
0.1% |
0.1% |
% |
|
Exotic |
0.3% |
0.3% |
0.3% |
0.3% |
0.2% |
% |
Source: IRI, Total US, MULO, % of total meat department dollars | “All other” not reflected
What’s Next?
The meat landscape continues to be in flux. Supply and demand in foodservice and food retailing has yet to find a new balance as consumer engagement continues to evolve. The past few weeks have seen spikes in COVID-19 cases and hospitalizations in some regions that had previously relaxed restrictions. The new outbreaks are likely to impact business activities, restaurant engagement and shopper behaviors in those regions. These outbreaks are also likely to prompt the continuation of social distancing measures and behaviors in hard-hit states. In IRI’s ongoing consumer sentiment tracking survey, the share of consumers more concerned about COVID-19 than the week prior is up from 15% to 22%. The Trump administration announced last week that it is preparing for a second wave of COVID-19 that could hit the country in the fall. Between the continued impact of COVID-19 and significant economic pressure, it is likely that demand for meat in retail will continue to track well above 2019 levels for the foreseeable future.
As consumers are getting fatigued with tried-and-true recipes, a major opportunity lies in providing tips, recipes and ideas on how to serve up something different. With grilling season officially here, the meat department has many opportunities to help consumers shake up their in-home cooking.
Next week’s report will cover the last week of June. Depending on the level of preparation, consumers may have started on their July 4th shopping. Independence Day is traditionally strong meat holiday and much like Memorial Day, about half of shoppers are expecting to celebrate the Fourth differently, with less travel and smaller celebrations.
210 Analytics and IRI will provide sales updates weekly. Meanwhile, please thank the entire meat and poultry industry, from farm to store, for all they do to ensure supply during these unprecedented times. #MeatFeedsFamilies #SupermarketSuperHeroes
Source: 210 Analytics/IRI
Looking for a reprint of this article?
From high-res PDFs to custom plaques, order your copy today!