February delivers strong results for the meat department
After an increase in store trips during the December holidays, store visits once again dropped below year ago levels during February. At the same time, the pattern of highly elevated trip baskets continued, particularly during February when visits dropped below year ago levels. This means continued emphasis on optimizing each trip through excellence in in-store merchandising, in-stock performance, cross-merchandising and meal solutions.
Sales of all food and beverage related items remained elevated from January’s strong increase of +12.0%. February sales increased 11.8% over the weeks ending February 3 through February 28 versus the same weeks in 2020. Both months are up significantly from a subdued December (+8.1%).
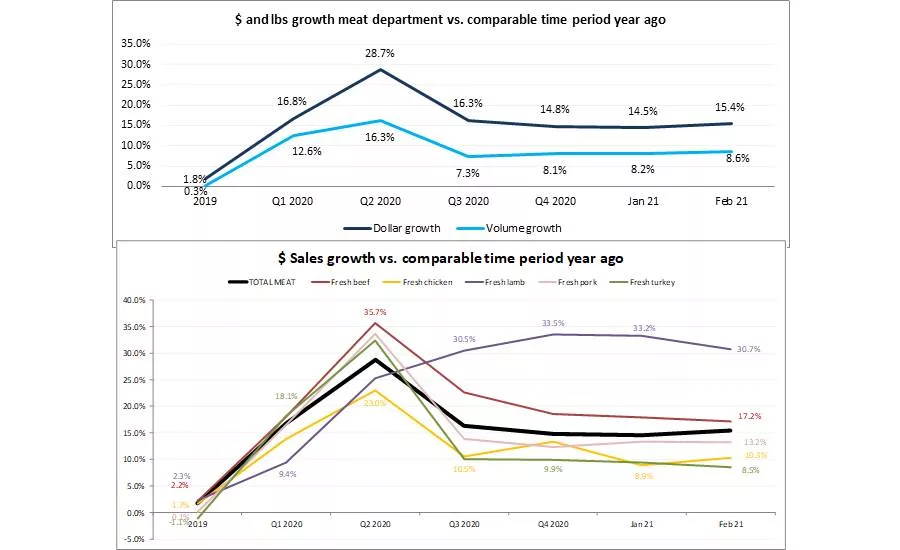
As seen all throughout the pandemic, the meat department is an above-average performer. January was off to a strong start and sales accelerated even further in February. Meat department sales increased 15.4%, which excludes online-only and delivery e-commerce sales, but does include pick-up-in-store fulfillment like click-and-collect and personal shopper delivery. Meat department multi-outlet sales for the four weeks ending February 28 gained an additional $807 million versus the comparable period in 2020.
|
Meat department |
Dollar sales |
Dollar gains |
Absolute dollar gains |
|
2019 calendar year |
$69.2B |
+1.8% |
+$1.2B |
|
Q1 2020 |
$19.6B |
+16.8% |
+$2.8B |
|
Q2 2020 |
$22.3B |
+28.7% |
+$5.0B |
|
Q3 2020 |
$20.2B |
+16.3% |
+$2.8B |
|
Q4 2020 |
$20.5B |
+14.9% |
+$2.7B |
|
January 2021 (w.e. 1/3-1/31/2021) |
$7.6B |
+14.5% |
+$966M |
|
February 2021 (w.e. 2/7-2/28/2021) |
$6.0B |
+15.4% |
+$807M |
Source: IRI, Integrated Fresh, Total US, MULO, see end for time period definitions
February had two big sales opportunities in Super Bowl, on February 7, and Valentine’s Day, that typically both see a lot of the food dollar flowing to foodservice. With many restaurants still operating with limited on-premise dining, food retailing strongly benefited.
The meat department dollar sales gain of 15.4% exceeded that of the fourth quarter and January, importantly, the volume gains were the highest since the second quarter of 2020, at +8.6%. Dollars and volume trended 6.8 points apart — significantly closer than during most of 2020.
Fresh meat made up the majority share of sales, at $4.0B, but had slightly lower gains (+14.6%) than processed meats (+17.2%) in February 2021. Additionally, volume gains were slightly higher for processed meats, at +17.2%. That resulted in the gap between volume and dollars increasing a little to 6.8 percentage points for meat overall, but less for processed meat, at 6.0 points.
|
% sales change (February 2/7-2/28) versus year ago |
Dollar size |
Dollar gains |
Volume gains |
Volume/dollar gap |
|
Total meat |
$6.0B |
+15.4% |
+8.6% |
-6.8 |
|
Total fresh |
$4.0B |
+14.6% |
+7.5% |
-7.1 |
|
Total processed |
$2.0B |
+17.2% |
+11.2% |
-6.0 |
Source: IRI, Integrated Fresh, Total US, MULO, % gain versus YA
Price per Volume
Most proteins saw significant increases in the price per volume throughout 2020. In February 2021, the price per volume across all species remained 6.3% over year ago levels, with pork and turkey showing the lowest inflation, at around +4%. Note: Pork does not include Smoked Ham, which is reported in Processed Meats.
|
|
Average price per volume and change |
|||||||
|
|
2019 |
Q1 20 |
Q2 20 |
Q3 20 |
Q4 20 |
Jan 21 |
Feb 21 |
|
|
Meat department |
$3.53 |
$3.72 |
$3.99 |
$3.96 |
$3.51 |
$3.85 |
$3.95 |
+6.3% |
|
Total fresh meat |
$3.35 |
$3.55 |
$3.92 |
$3.78 |
$3.30 |
$3.67 |
$3.77 |
+6.6% |
|
Total processed meat |
$3.96 |
$4.13 |
$4.15 |
$4.39 |
$4.01 |
$4.27 |
$4.37 |
+5.4% |
|
Fresh beef |
$4.88 |
$4.97 |
$5.82 |
$5.42 |
$5.21 |
$5.19 |
$5.26 |
+5.3% |
|
Fresh chicken |
$2.33 |
$2.40 |
$2.45 |
$2.46 |
$2.43 |
$2.51 |
$2.54 |
+6.4% |
|
Fresh pork |
$2.66 |
$2.78 |
$3.02 |
$2.81 |
$2.72 |
$2.77 |
$2.85 |
+4.2% |
|
Fresh turkey |
$2.03 |
$3.14 |
$3.25 |
$3.43 |
$1.51 |
$3.05 |
$3.39 |
+4.1% |
|
Fresh lamb |
$7.79 |
$7.91 |
$8.24 |
$8.51 |
$8.31 |
$8.22 |
$8.56 |
+9.1% |
Source: IRI, Integrated Fresh, Total US, MULO, price per volume and % gain versus YA
Assortment
Variety continues to make a comeback nearly one year after the onset of the pandemic. Assortment dropped by more than 65 items during some of the tightest supply weeks in May and June of 2020. In February 2021, assortment averaged 576 items per store, which was down about 3.2% versus year ago levels, although not all new item codes may be tallied just yet. This is the widest assortment since the start of the pandemic.
|
|
Average items per store selling for week ending… |
|||||||
|
|
2019 |
Q1 20 |
Q2 20 |
Q3 20 |
Q4 20 |
Jan 21 |
Feb 21 |
|
|
Items |
572.2 |
568.1 |
568.9 |
561.8 |
567.2 |
563.2 |
575.8 |
|
|
Change |
-1.0% |
-1.4% |
-9.0% |
-5.8% |
-3.7% |
-3.6% |
-3.2% |
|
Source: IRI, Integrated Fresh, Total US, MULO, average items per store selling
Fresh Meat Gains by Protein
In February 2021, beef accounted for 64% of all additional dollars over this month in 2020, but chicken had a strong month, at least in part driven by Super Bowl chicken wing sales. Chicken was the second-largest contributor to sales gains, at +$97 million versus year ago. Lamb had the highest percentage dollar gains, at +30.7%, but off a much smaller base.
|
February 2021 |
Dollar sales |
Dollar gains |
Absolute dollar gains |
Volume gains |
|
Meat department |
$6.0B |
+15.4% |
$807M |
+8.6% |
|
Total fresh meat |
$4.0B |
+14.6% |
$516B |
+7.5% |
|
Fresh beef |
$2.2B |
+17.2% |
$328M |
+11.2% |
|
Fresh chicken |
$1.0B |
+10.3% |
$97M |
+3.7% |
|
Fresh pork |
$511M |
+13.2% |
$60M |
+8.7% |
|
Fresh turkey |
$156M |
+8.5% |
$12M |
+4.2% |
|
Fresh lamb |
$38M |
+30.7% |
$9M |
+19.8% |
Source: IRI, Integrated Fresh, MULO, % growth versus year ago
Lamb has led all growth since the third quarter of 2020 and has remained very stable at around 30-34% over year ago levels. Beef, while the largest of the fresh proteins in dollar sales, has consistently posted the second-highest growth, in the high teens. Chicken and turkey gains have been in the high single, low double digits in the last few quarters and the start of 2021.
Processed meats continued their strong January start. Bacon generated the highest sales, at $490 million, as well as the highest gains, at +28.1% in January 2021 versus year ago during February. Packaged lunchmeat, the second largest seller, had the lowest increase but was still up 9.4% versus year ago. This was up from 8.2% in January. Hot dogs continue to have an astounding performance as a versatile and kid-friendly item, up 14.1% over year ago.
|
|
$ sales gains versus comparable period year ago |
|||||||
|
|
2019 |
Q1 20 |
Q2 20 |
Q3 20 |
Q4 20 |
Jan 21 |
Feb 21 |
|
|
Meat department |
+1.8% |
+16.8% |
+28.7% |
+16.3% |
+14.9% |
+14.5% |
+15.4% |
$6.0B |
|
Processed meat |
+1.9% |
+16.6% |
+22.5% |
+13.0% |
+12.8% |
+14.4% |
+17.2% |
$2.0B |
|
Bacon |
+2.9% |
+13.9% |
+33.0% |
+17.8% |
+19.0% |
+22.8% |
+28.1% |
$490M |
|
Packaged lunchmeat |
-0.6% |
+13.3% |
+11.4% |
+5.4% |
+9.8% |
+8.2% |
+9.4% |
$411M |
|
Dinner sausage |
+2.6% |
+21.6% |
+32.2% |
+15.9% |
+13.8% |
+13.5% |
+18.6% |
$335M |
|
Frankfurters |
+0.2% |
+24.0% |
+22.5% |
+15.8% |
+17.1% |
+9.4% |
+14.1% |
$171M |
|
Breakfast sausage |
+1.8% |
+14.3% |
+35.8% |
+20.0% |
+13.6% |
+19.1% |
+20.7% |
$161M |
|
Smoked ham |
-0.9% |
+32.7% |
30.7+% |
+17.1% |
+3.8% |
+12.2% |
+18.4% |
$68M |
Source: IRI, Integrated Fresh, Total US, MULO, % change vs. YA
Grinds
In February 2021, grinds continued to do extremely well. Ground beef sales totaled $1.0 billion in dollars and 257 million pounds. Ground beef alone added $74 million versus year ago levels in February. Altogether, the meat grinds listed below generated an additional $90 million during the four February weeks versus an additional $4.4 million for refrigerated plant-based meat alternatives that continue to see aggressive growth, at +85.2%
|
% sales change (February 2021) versus year ago |
Dollar sales |
Dollar gains |
|
Ground beef |
$850M |
+9.6% |
|
Ground chicken |
$18M |
+16.1% |
|
Ground lamb |
$3M |
+37.6% |
|
Ground plant-based meat alternatives |
$10M |
+85.2% |
|
Ground pork |
$14M |
+15.9% |
|
Ground turkey |
$120M |
+8.6% |
|
Ground veal |
$0.9M |
+18.1% |
Source: IRI, Integrated Fresh, Total US, MULO, % change vs. YA
What’s Next?
In March 2021, sales will go up against the two biggest weeks in the history of grocery retailing and will likely turn negative versus year ago. However, based on the pattern of the last few months, sales are likely still going to track ahead against the baseline of 2019. With the average number of new COVID-19 cases coming down, pent up demand for eating out is likely going to increase foodservice spending, particularly as more states are opening up on-premise dining. Additionally, increases in gasoline sales, OpenTable reservations, TSA checkpoint numbers, the re-opening of schools and other indicators are pointing to increased consumer mobility. Increased mobility is also likely to result in a switch from home-centric food spending to greater foodservice engagement, and may drive increased demand for time-saving, convenience focused solutions in the meat department.
With an early Easter, on April 4, March is likely going to see a spike in Easter powerhouses, which will fuel even higher lamb sales. It is unlikely that gatherings will be back to pre-pandemic group sizes as travel remains below typical levels. That means another holiday where shoppers may be looking for meats and sides to accommodate a smaller group size. Deli-prepared holiday meal solutions have seen tremendous success for the summer, fall and winter holidays.
Source: 210 Analytics/IRI
Looking for a reprint of this article?
From high-res PDFs to custom plaques, order your copy today!