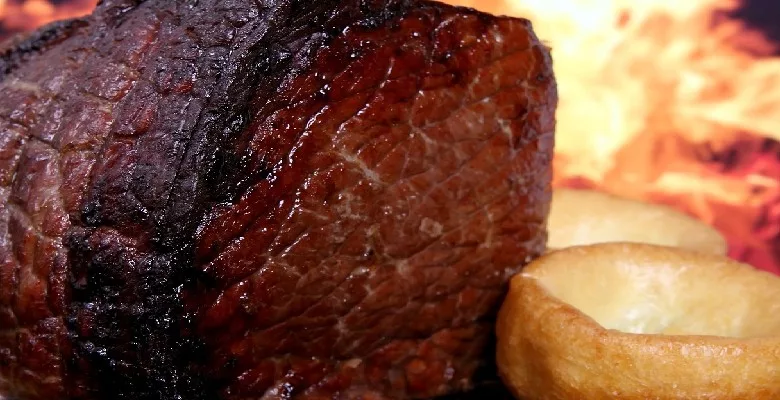
Thanksgiving serves mixed results for the meat department
Inflation eats into consumers' Thanksgiving spending.
The November marketplace
As one of the biggest food holidays in America, Thanksgiving sales make or break November in food retailing. According to the mid-November IRI survey of primary shoppers, many Americans were back to celebrating like normal with an expected increase in the number of people in the party when compared to the last two years. As such, COVID-19 seemed less of a concern in the planning of Thanksgiving celebrations, but inflation did take a bite out of Thanksgiving spending.
- The mid-November IRI consumer study found that one in five Americans were worried about being able to afford the type of Thanksgiving celebration they usually have because of inflation. Worries were significantly higher among Gen Z and Millennials, at 30% and 26%, versus 12% among Boomers.
- According to IRI point-of-sales data for the multi-outlet channel, in the two weeks before Thanksgiving, prices were up more than +14% over year ago levels. Beverages had the most modest price increases, at +5.0%, followed by meat, at +11.4%. The highest inflation was seen for holiday sides and baked goods.
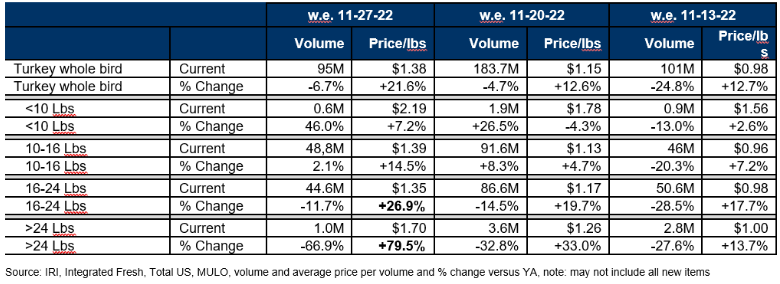
- Importantly, throughout the pandemic, the week before the holiday week had generated the biggest shopping volume, but pre-pandemic patterns are back. The week of the holiday is once more the heaviest shopping week, with the exception of turkey, where sales spiked the week ending November 20, 2022.
- IRI analyzed categories across the store for five years of holiday history and found many categories see a significant lift in sales in the runup to Thanksgiving. Big winners include frozen and refrigerated whipped toppings, potatoes and yams, green beans, dinner rolls, stuffing ingredients and, of course, ham and turkey. While dollar sales were up for all this year in IRI point-of-sales, volume was down in most categories — signaling that people are managing their grocery spend by purchasing less or smaller packages.
- At the same time, some Americans needed a break and sourced their Thanksgiving meal from restaurants. While a mere 5% ate their Thanksgiving meal on premise, 18.2% of Thanksgiving meals were sourced from foodservice according to the IRI November survey.
- The hybrid meal, in which consumers made some Thanksgiving meal items from scratch and used semi- and fully-prepared items for others, was popular this year. Only 33.4% of Americans in the mid-November IRI survey prepared a fully homemade meal, leaving two-thirds of meals that integrated ready-to-eat and heat-and-eat options sourced from grocery stores, meal kits or restaurants.
- Also observed in the IRI November survey, Thanksgiving meal traditions vary across the United States. The Northeast is more likely to serve cranberries and pumpkin pie, whereas the Southeast likes their apple pie and Brussels sprouts.
- Further, the reported shift of supply and shoppers to smaller whole bird turkeys was real in Nov 2022:
For the everyday meal occasion shoppers also balance home-prepared meals with restaurant options.
- Consumers estimate that 78.9% of all meals are prepared in the home, according to the IRI November consumer survey. This is slightly higher than it has been, driven by very high percentages of home-based meals among Boomers and seniors.
- Also in the IRI November survey, 8 in 10 Americans have purchased from restaurants in the past month. Takeout (53%) and on-premise dining (51%) are the most popular. Restaurant delivery is more important among Gen Z (30%) than Boomers (11%).
- Inflation plagues everyday grocery purchases also, with IRI’s November survey respondents identifying eggs, milk and produce as the top areas of having higher prices than last year. A record-high 96% of consumers are concerned about the price increases, resulting in 84% of consumers are making changes to their grocery shopping to manage inflation — which is also a record high. Popular money-saving measures are sales specials, cutting back on non-essentials and buying store brands. At the same time, 54% of shoppers say fewer of the items they want are on sale and 50% believe the items are not discounted as much.
IRI, 210 Analytics and Marriner Marketing continue to team up to bring the latest trends and analysis relative to meat department sales, including fresh and processed items.
Inflation insights
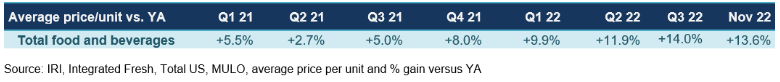
The price per unit across all foods and beverages in the IRI-measured multi-outlet stores, including supermarkets, club, mass, supercenter, drug and military, increased +13.6% in November (the four weeks ending 11/27/2022).
This increase was virtually unchanged from +13.7% in October. November year-on-year inflation was +17.0% in the center of the store (grocery) and +11.3% for perishables. Compared with November 2019, prices across all foods and beverages were up +28.7%.
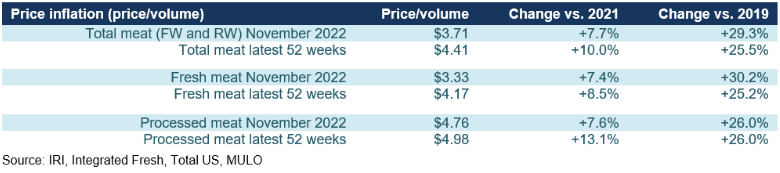
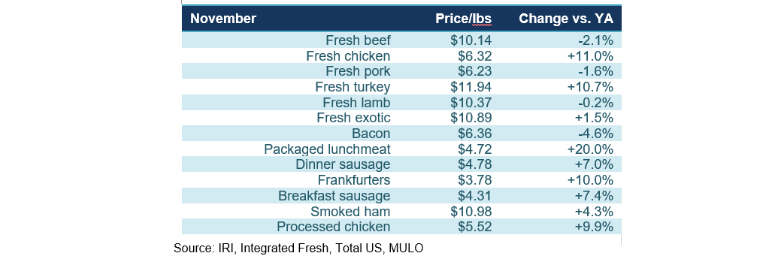
The average price per pound in the meat department across all cuts and kinds, both fixed and random weight, stood at $3.71 in November 2022. That is significantly below the typical monthly average because of the Thanksgiving promotions. For instance, October averaged $4.53 per pound. Inflation for total meat was down to +7.7% in November and +10.0% during the latest 52 weeks. This means meat had below-average inflation compared to total foods and beverages, especially on the fresh meat side. Inflation in processed meat also dropped into single-digits.
By protein, the moderation in price increases is driven by beef, pork and bacon. On the other hand, both chicken and turkey continued to experience double-digit inflation, though the increases are moderating here as well. Packaged lunchmeat had the highest increases of all, at +20.0% over November 2021 levels.
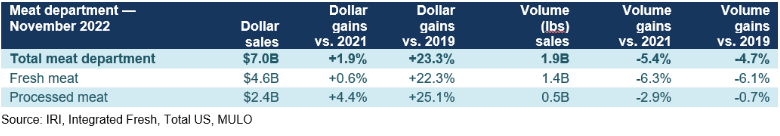
Meat sales November 2022
With inflation moderating, the year-on-year growth numbers are coming down a bit. November dollars exceeded prior year levels by +1.9% but volume sales dropped. November volume moved significantly below the 2019 pre-pandemic levels for fresh meat, pulling down total meat volume sales with it.
Meat sales growth versus year ago is tapering off more and more as inflation is moderating. At +1.9%, gains are the lowest since the second quarter of 2021. 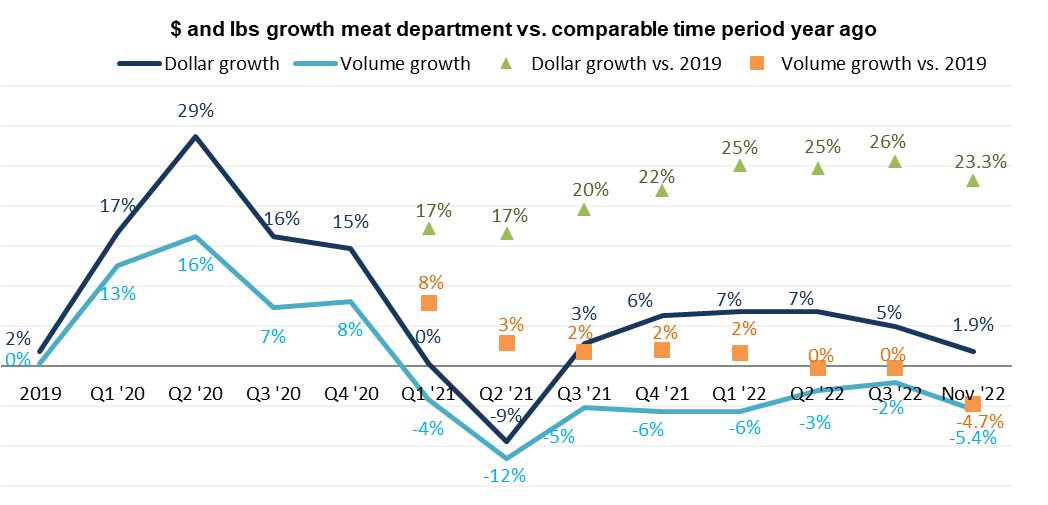 Source: IRI, Integrated Fresh, MULO
Assortment
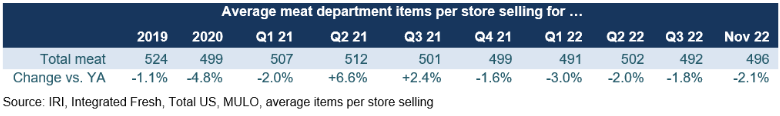
Fewer items had to work harder to achieve the same level of sales. At an average of 496 items per store, assortment was -2.1% behind 2021 levels and -7.0% lower than in November 2019. The decline is driven by processed meat, that is down -9.2% in average items per store compared to 2019.
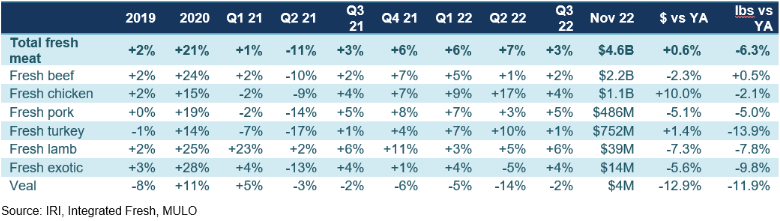
Fresh meat by protein
Total fresh meat sales were up +0.6% in November 2022 versus year ago. Chicken delivered big, but this was inflation driven. Beef that has experienced a decrease pricing over the last couple of months was rewarded with positive pound growth.
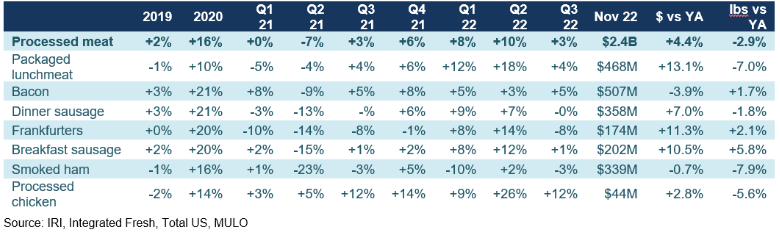
Processed meat
Packaged lunchmeat, frankfurters and breakfast sausage led dollar growth in November 2022 versus year ago. However, in the case of packaged lunchmeat, it is driven by substantial increases in price increases. There were several areas with positive volume growth, being bacon, frankfurters and breakfast sausage.
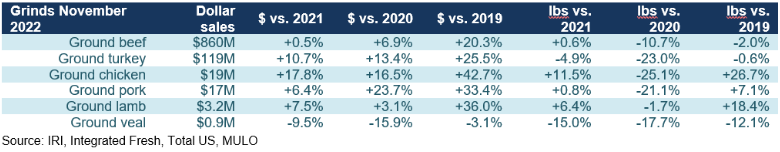
Grinds
Grinds generated $860 million in the four November weeks, with 84% of dollars and pounds being generated by ground beef. Despite being a massive seller, ground beef matched last year’s volume sales. Ground turkey had high dollar gains but fell -4.9% behind on pounds.
What’s next?
Thanksgiving holiday shopping and consumption patterns provide a glimpse at what the Winter holiday season may look like. According to the IRI November survey, consumers are split between being excited to have something to celebrate and pulling back on spending given the reduction in purchasing power.
Meals do remain central to celebrations. For Christmas, 22% prepare a special meal for just their household and 17% host or attend a meal with friends or family outside of the immediate household. Others go on a vacation, travel or had not yet made plans in the November survey for the December holidays.
The next performance report in the IRI, 210 Analytics and Marriner Marketing series will be released mid-January 2022 to cover the December and year-end sales trends.
Please thank the entire meat and poultry industry, from farm to store, for all they do.
Date ranges:
2019: 52 weeks ending 12/28/2019
2020: 52 weeks ending 12/27/2020
Q1 2021: 13 weeks ending 3/28/2021
Q2 2021: 13 weeks ending 6/27/2021
Q3 2021: 13 weeks ending 9/26/2021
Q4 2021: 13 weeks ending 12/26/2021
Q1 2022: 13 weeks ending 3/27/2022
Q2 2022: 13 weeks ending 6/26/2022
Q3 2022: 13 weeks ending 9/25/2022
September 2022: 4 weeks ending 9/25/2022
October 2022: 5 weeks ending 10/30/2022
November 2022: 4 weeks ending 11/27/2022
Looking for a reprint of this article?
From high-res PDFs to custom plaques, order your copy today!


