Special Report | Top 100 Processors
2020 Top 100 meat and poultry processors: Storm clouds on the horizon
Even before Covid-19 shut down the country, the meat processing industry was cautious about 2020 and beyond.

Typically, the Top 100 serves as a good indicator of how the industry has performed, and what the expectations were for the coming year. If the industry is going through strong periods, we will see record sales, acquisitions, expansions and other initiatives. If the industry is pinched because of high prices or a slowdown in the economy, sales drop and future plans become a little more conservative.
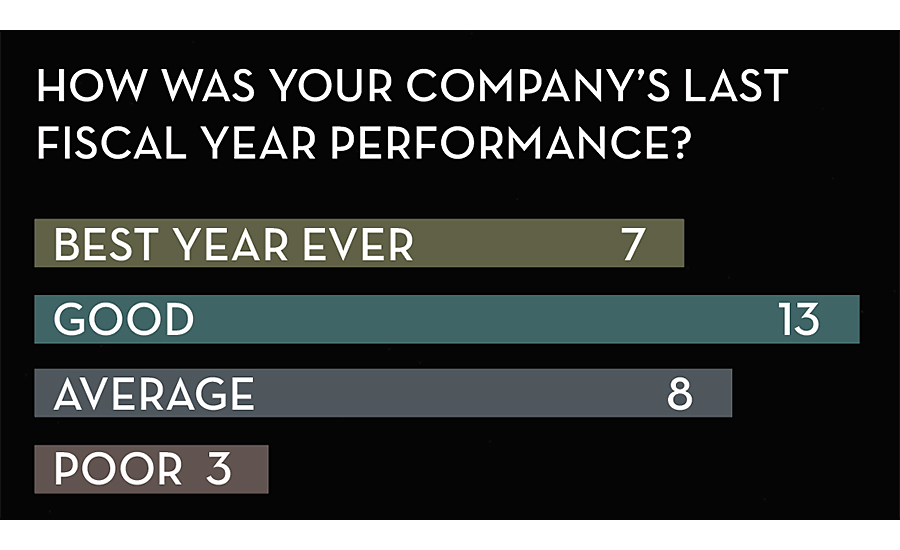
Even before the impact of the Coronavirus became fully realized in the United States, there were signs that the meat industry was starting to slow down. This year, respondents to our Top 100 Survey were asked to describe their more recent fiscal year’s performance. Seven companies called it their best year ever, while 13 more described it as merely “good.” These results are a reverse of last year’s poll, when 10 companies described their last year as their best ever, as opposed to six votes for good. There are still plenty of companies that showed impressive growth in the Greatest Gains List. However, the responses for this year’s report were more subdued than previous editions.
2020 Top 100 Index:
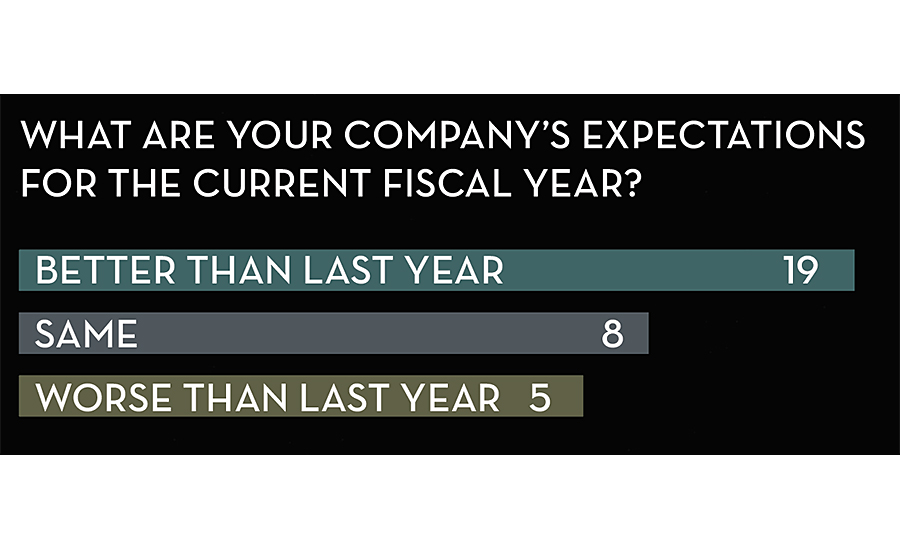
Naturally, the onset of the Coronavirus and its effect on the country have affected the outlook for the future. The first forms that were returned before shelter-in-place orders were more optimistic than the ones that were submitted later. The last submissions came when the effects of COVID-19 were evident, to the country in general and the meat industry specifically. The majority of this year’s respondents still have expectations of a better year next year (19 out of 32). However, 13 companies expect 2021 to be the same if not worse than the current year.
When asked to list the concerns for the next year, COVID-19 was overwhelmingly the top worry. Specifically, there were concerns about employee welfare, the impact on the foodservice industry, the aftermath, and the volatility of the pork market. There were other issues as well. Labor is perpetually a problem in the meat industry, whether it refers to recruitment or retention. Animal diseases, especially ASF (African Swine Fever), were listed by multiple companies. Other concerns included the beef market volatility, exports, supply chain issues, alternative meat products, lack of consistent and quality inspection, cost of doing business, and wage growth.
While many processors saw the potential problems that COVID-19 can cause the industry, some saw a bright side. When asked to provide their greatest opportunities for the coming year, some companies did think that they could emerge from the pandemic as a stronger company or find growth in the aftermath. Other opportunities included new product releases, completing expansions or utilizing just-completed expansions, export markets, e-commerce and utilizing FSIS line speed waivers. NP
If you would like your company to be included in the 2020 Top 100 Report or the Greatest Gains report, contact Sam Gazdziak at gazdziaks@bnpmedia.com.
2020 Market Segment Reports
Select a market segment in order to view the report:
| Company | Sales in Sector (in millions) |
Overall Sales (in millions) |
|---|---|---|
| OSI Group LLC | 2,532 | 6,330 |
| Hormel Foods | 855 | 9,500 |
| Branding Iron Holdings | 401.8 | 410 |
| Colorado Premium | 357 | 420 |
| Golden State Foods | 339.5 | 350 |
| STX Beef Co. | 267 | 267 |
| Jensen Meat Co. Inc. | 198.5 | 200.5 |
| JTM Food Group | 159.8 | 228 |
| Monogram Foods | 115.6 | 467.9 |
| John Soules Foods Inc. | 106 | 482 |
| ProPortion Foods LLC | 80 | 160 |
| George’s | 63 | 1,575 |
| Eddy Packing Co. Inc. | 60 | 300 |
| Abbyland Foods Inc. | 54.4 | 320 |
| Fresh Mark Inc. | 25.7 | 1,287 |
| Company | Sales in Sector (in millions) |
Overall Sales (in millions) |
|---|---|---|
| Mountaire Farms Inc. | 2,323 | 2,323 |
| George’s | 1,480.5 | 1,575 |
| House of Raeford Farms Inc. | 980 | 980 |
| Case Farms Inc. | 821 | 821 |
| OSI Group LLC | 759.6 | 6,330 |
| John Soules Foods Inc. | 371.1 | 482 |
| Foundation Food Group | 240 | 240 |
| Hormel Foods | 190 | 9,500 |
| Fresh Mark Inc. | 103.0 | 1,287 |
| Eddy Packing Co. Inc. | 90 | 300 |
| Monogram Foods | 65.5 | 467.9 |
| Colorado Premium | 50.4 | 420 |
| Abbyland Foods Inc. | 38.4 | 320 |
| ProPortion Foods LLC | 35.2 | 160 |
| Indiana Packers Corp. | 24 | 1,200 |
| Company | Sales in Sector (in millions) |
Overall Sales (in millions) |
|---|---|---|
| Hormel Foods | 4,940 | 9,500 |
| OSI Group LLC | 1,772.4 | 6,330 |
| Fresh Mark Inc. | 1,158.3 | 1,287 |
| Indiana Packers Corp. | 1,128 | 1,200 |
| Rantoul Foods dba Agar Foods | 290.5 | 290.5 |
| Monogram Foods | 234.0 | 467.9 |
| Abbyland Foods Inc. | 211.2 | 320 |
| Swaggerty’s Farm | 157.6 | 157.6 |
| Williams Sausage Co. | 131.5 | 131.5 |
| Cloverdale Foods Co. | 97.6 | 122 |
| Sunnyvalley Smoked Meats Inc. | 93.7 | 104.1 |
| Eddy Packing Co. Inc. | 90 | 300 |
| Trim-Rite Food Corp. | 78 | 78 |
| Burgers’ Smokehouse | 77.7 | 84.5 |
| JTM Food Group | 45.6 | 228 |
| Company | Sales in Sector (in millions) |
Overall Sales (in millions) |
|---|---|---|
| Hormel Foods | 1,900 | 9,500 |
| Dakota Provisions LLC | 208.3 | 267 |
| OSI Group LLC | 63.3 | 6,330 |
| Eddy Packing Co. Inc. | 60 | 300 |
| Monogram Foods | 51.5 | 467.9 |
| Indiana Packers Corp. | 36 | 1,200 |
| JTM Food Group | 22.8 | 228 |
| Abbyland Foods Inc. | 16 | 320 |
| George’s | 15.8 | 1,575 |
| Sunnyvalley Smoked Meats Inc. | 10.4 | 104.1 |
| Company | Sales in Sector (in millions) |
Overall Sales (in millions) |
|---|---|---|
| Hormel Foods | 570 | 9,500 |
| OSI Group LLC | 506.4 | 6,330 |
| Mountaire Farms Inc. | 305.9 | 2,323 |
| Indiana Packers Corp. | 240 | 1,200 |
| Fresh Mark Inc. | 128.7 | 1,287 |
| Case Farms Inc. | 114.9 | 821 |
| House of Raeford Farms Inc. | 107.8 | 980 |
| Rantoul Foods dba Agar Foods | 87.2 | 290.5 |
| Dakota Provisions LLC | 80.1 | 267 |
| George’s | 78.8 | 1,575 |
| Company | Sales in Sector (in millions) |
Overall Sales (in millions) |
|---|---|---|
| Hormel Foods | 1,425 | 9,500 |
| OSI Group LLC | 316.5 | 6,330 |
| George’s | 315 | 1,575 |
| Colorado Premium | 42 | 420 |
| Carl Buddig Co. | 35.3 | 705 |
| ProPortion Foods LLC | 24 | 160 |
| Dakota Provisions LLC | 13.4 | 267 |
| Foundation Food Group | 12 | 240 |
| John Soules Foods Inc. | 4.8 | 482 |
| Jensen Meat Co. Inc. | 2.0 | 200.5 |
| Company | Sales in Sector (in millions) |
Overall Sales (in millions) |
|---|---|---|
| Hormel Foods | 2,280 | 9,500 |
| Monogram Foods | 201.1 | 467.9 |
| Fresh Mark Inc. | 167.3 | 1,287 |
| Abbyland Foods Inc. | 16 | 320 |
| Burgers’ Smokehouse | 8.5 | 84.5 |
| Company | Sales in Sector (in millions) |
Overall Sales (in millions) |
|---|---|---|
| Hormel Foods | 6,650 | 9,500 |
| George’s | 1,102.5 | 1,575 |
| Indiana Packers Corp. | 960 | 1,200 |
| Fresh Mark Inc. | 900.9 | 1,287 |
| House of Raeford Farms Inc. | 842.8 | 980 |
| Case Farms Inc. | 591.1 | 821 |
| OSI Group LLC | 506.4 | 6,330 |
| Colorado Premium | 252 | 420 |
| STX Beef Co. | 227 | 267 |
| Eddy Packing Co. Inc. | 210 | 300 |
| Company | Sales in Sector (in millions) |
Overall Sales (in millions) |
|---|---|---|
| OSI Group LLC | 5,823.6 | 6,330 |
| Hormel Foods | 570 | 9,500 |
| George’s | 472.5 | 1,575 |
| Branding Iron Holdings | 401.8 | 410 |
| John Soules Foods Inc. | 390.4 | 482 |
| Golden State Foods | 280 | 350 |
| Indiana Packers Corp. | 240 | 1,200 |
| Case Farms Inc. | 229.9 | 821 |
| JTM Food Group | 228 | 228 |
| Abbyland Foods Inc. | 224 | 320 |
View All Market Segment Reports
Looking for a reprint of this article?
From high-res PDFs to custom plaques, order your copy today!


