Meat department volume gains hit double digits once more
The week ending July 19 was the second of eight non-holiday weeks between Independence Day and Labor Day. Over the past two months, everyday demand had been experiencing week to week erosion as consumers started reengaging with foodservice. However, the rising number of cases of COVID-19 around the country prompted many states to roll back at least some of the previously relaxed social distancing measures, including restaurant capacity and dine-in mandates. This reversal along with rising consumer concern over COVID-19 is shifting dollars back from foodservice to food retail once more.
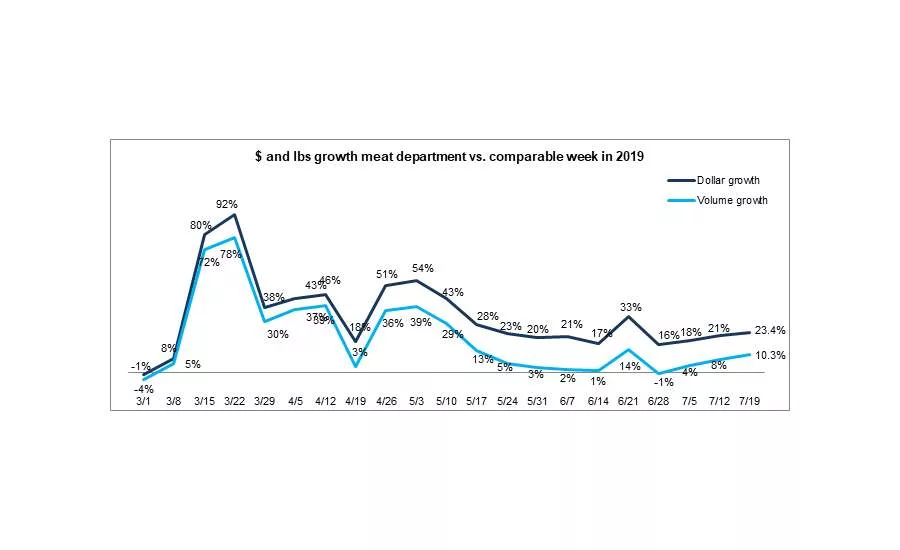
For the week of July 19, the elevated everyday demand resulted in a 23.4% increase in dollar sales versus year ago for the meat department. This is two percentage points higher than the prior week and the highest gain since late May. This also became the 18th week of double-digit gains since the onset of the pandemic. While higher prices drove much of this gain, volume gains hit double digits for the first time since the week of June 21, Father’s Day week, at +10.3%. Unit sales continue to wow as well, with 19.6 million more transactions compared with same week year ago and 820 million more transactions since the pandemic began. Pre-pandemic, total meat department units were down versus year ago. This points to more, but smaller, packages sold.
So far during the pandemic, starting March 15 through July 19, dollar sales are up 35.3% and volume sales have increased 21.9% versus the same period last year. This translates into an additional $7.7 billion in meat department sales during the pandemic, which includes an additional $3.5 billion for beef, $1.1 billion for chicken and $814 million for pork.
Dollar versus Volume Gains
The total meat volume/dollar gap narrowed slightly to 13.4 points, from 13.7 points the week prior. Fresh meat had a slightly stronger week than processed meat in dollars, but processed had higher volume gains. The volume/dollar gap is five points wider for fresh than processed.
|
Latest 1 week ending July 19, 2020 versus comparable week in 2019 |
Dollar gains |
Volume gains |
Volume/dollar gap |
|
Total meat |
+23.4% |
+10.3% |
-13.1 |
|
Total fresh |
+23.9% |
+9.7% |
-14.2 |
|
Total processed |
+21.7% |
+12.5% |
-9.2 |
Source: IRI, Total US, MULO, 1 week % gain versus YA
The longer, four-week look ending July 19 also shows double-digit volume/dollar gaps for fresh beef and pork, as well as frankfurters. Given the impact of beef and pork on total sales, these proteins caused a double-digit volume/dollar gap for total meat as well, despite much lower inflation for turkey and chicken and deflation for exotic meats. The four-week gap narrowed slightly — similar to the one week view.
|
Latest 4 weeks ending July 19, 2020 versus comparable weeks in 2019 |
Dollar gains |
Volume gains |
Volume/dollar gap |
|
Total meat |
+23.4% |
+10.3% |
-13.1 |
|
Fresh beef |
+30.4% |
+14.1% |
-16.3 |
|
Ground beef |
+24.9% |
+8.0% |
-16.9 |
|
Fresh chicken |
+14.2% |
+7.0% |
-7.2 |
|
Fresh pork |
+17.1% |
+3.7% |
-13.4 |
|
Fresh turkey |
+18.8% |
+16.1% |
-2.7 |
|
Fresh lamb |
+40.5% |
+31.5% |
-9.0 |
|
Fresh exotic |
+38.9% |
+43.6% |
+4.7 |
|
Fresh veal |
+28.3% |
+24.1% |
-4.2 |
|
Smoked ham/pork |
+29.2% |
+29.3% |
+0.1 |
|
Sausage |
+21.8% |
+15.8% |
-6.0 |
|
Frankfurters |
+16.9% |
+1.9% |
-15.0 |
|
Bacon |
+23.1% |
+15.3% |
-7.8 |
Source: IRI, Total US, MULO, 4 weeks ending July 19, 2020 versus YA
Assortment
Dipping well below 300 during the height of the supply chain woes, assortment leaped to an average of 321 items per store during Independence Day week. Assortment fell back down during the non-holiday week ending July 12, averaging 315 items per store, but rebounded a bit the week of July 19 to 317 items. This is 23 items down versus the same week last year and it appears that SKU rationalization may have post-pandemic legs.
|
Average weekly items per store selling for week ending… |
||||||||||
|
3/1 |
3/8 |
3/15 |
3/22 |
3/29 |
April (4/5-4/26) |
May (5/3-5/31) |
June (6/7-6/28) |
7/5 |
7/12 |
7/19 |
|
335 |
334 |
353 |
330 |
308 |
315 |
301 |
304 |
321 |
315 |
317 |
Source: IRI, Total US, MULO, average weekly items per store selling
Christine McCracken, Executive Director Food & Agribusiness for Rabobank, is reporting postive production results. “This week's cattle harvest was relatively flat with year-ago levels, with total beef production up 2.2% on heavier cattle weights. The USDA Inventory report released Friday shows a slight drop in on-feed supplies versus year-ago, but ample supplies to harvest in coming months. Retail beef interest has been slow and likely reflects higher shelf prices (lower discounting) and adequate inventories. With sluggish white table cloth sales, stimulus funds about to expire and high unemployment, we expect total beef demand to remain under some pressure. Pork markets remain surprisingly strong with prices up 2.6% versus last week, despite record production. Pork supplies are now 11.8% larger than year-ago, which continues to limit any additional improvement in composite values. Hog harvest for the week was up 9.7% from year-ago levels and 2.8% above last week. Ongoing labor issues have not interfered with the number of animals heading into the plant, but continue to inhibit further processing and deboning activities. Domestic pork demand remains sluggish with loins and bellies relatively weak, but export interest has been good. Mexico and Canada were active buyers and this should be supportive to prices in coming weeks. Chicken production continue to reflect cuts taken in the midst of COVID-19 disruption this spring, with RTC production down 5.2% versus year-ago on a 4.2% drop in slaughter.”
Price
While assortment and availability improved, consumers continued to call out higher meat prices and fewer meat features on the Retail Feedback Group’s Constant Customer Feedback (CCF) system. One shopper wrote, “Meat prices in general are TOO high.” Another shopper noted, “Stop raising your meat prices during a time that people are struggling to make ends meet.” Shoppers also commented on wanting hotter merchandised prices, “Meat prices are always a bit more here but the quality is good and I usually look for what is on sale. It seems you haven’t had good sales specials in months. Even when on promotion, the prices are much higher than before COVID-19.”
IRI’s insights on the average retail price per volume show double-digit increases when comparing prices during the week of July 19 to the same week in 2019, at +11.8%. Inflation is driven by beef and pork prices, though these did moderate versus the prior week. Only lamb prices increased between July 12 and July 19, 2020. The slightly longer four week look shows that prices are still coming down. The four week period ending July 19 shows prices up +13.6% versus the same four week period in 2019, versus 11.8% in the one-week look.
|
Average price per volume |
1 week ending July 19 |
4 weeks ending July 19 |
|||
|
Average |
Change vs. prior period |
Change |
Average |
Change vs. year ago |
|
|
Total meat |
$3.95 |
-0.8% |
+11.8% |
$3.98 |
+13.6% |
|
Fresh beef |
$5.69 |
-0.4% |
+14.3% |
$5.81 |
+17.7% |
|
Ground beef |
$4.40 |
-1.6% |
+15.7% |
$4.45 |
+18.8% |
|
Fresh chicken |
$2.47 |
-2.8% |
+6.7% |
$2.48 |
+8.9% |
|
Fresh pork |
$2.96 |
-0.5% |
+12.9% |
$2.93 |
+10.2% |
|
Fresh turkey |
$3.38 |
-1.8% |
+2.2% |
$3.41 |
+3.2% |
|
Fresh lamb |
$8.51 |
+4.2% |
+6.8% |
$8.46 |
+7.4% |
|
Fresh exotic |
$4.32 |
-3.9% |
-3.3% |
$4.42 |
-0.1% |
Source: IRI, Total US, MULO, 1 week and 4 weeks ending July 19, 2020
McCracken also provided an updated on pricing. “Despite the drop in production, chicken prices moved lower again — down 7% from last week — as ongoing weak exports continues to erode dark meat values. The slowdown in exports has left sizable inventories of thighs and drums for U.S. markets to clear. Good foodservice sales and improving promotional activity at retail are helping support boneless breast, wing and tender values, but improvements have been unable to offset historically low dark meat values. Wing demand remains robust, with steady demand at foodservice moving good volumes.”
Meat Gains by Protein
The overall 23.4% meat department gain was fueled by double-digit gains for all proteins, including chicken that improved dollar gains from 8.8% the week of July 12 to 14.2% the week of July 19. Lamb and beef had the highest percentage growth, at +40.5% and +30.4%. Beef easily had the highest absolute dollar gains (+$135 million), followed by chicken (+$31 million) and pork (+$20 million).
Grinds
The popularity of ground meat continues with double-digit increases in dollar sales for ground beef, turkey, chicken and pork. Ground chicken had the highest percentage gains, but off a small base, followed closely by ground beef. For the week ending July 19 versus year ago, these four ground proteins generated $231 million in sales, which represents an additional $50 million versus year ago. Ground beef represents 902% of these additional dollars.
- Ground beef increased 24.9% in dollars and saw its largest increase in volume since mid April, at +8.0%.
- Ground turkey, +16.5% in dollars and +12.6% in volume.
- Ground chicken, +25.3% in dollars and +19.6% in volume
- Ground pork, +22.4% in dollars and +18.5% in volume.
The Pandemic Sales Performance by Area
Meat department sales held steady at $1.4 billion during the week of July 19. Beef represented a big share, at $580 million, with a massive gain of 30.4%. All areas gained double digits versus the same week year ago, with the highest gain generated by lamb, though off a small base and the lowest gain by frankfurters, at +16.9%
|
2020 Weekly $ sales gains versus comparable 2019 week ending… |
$ |
|||||||
|
3/1 |
March |
April |
May (5/3-5/31) |
June (6/7-6/28) |
7/12 |
7/19 |
7/19 |
|
|
TOTAL MEAT |
-1% |
+54% |
+38% |
+32% |
+22% |
+21.4% |
+23.4% |
$1.4B |
|
Fresh |
||||||||
|
Beef |
0% |
+53% |
+42% |
+36% |
+27% |
+30.1% |
+30.4% |
$580M |
|
Chicken |
+1% |
+41% |
+32% |
+21% |
+13% |
+8.8% |
+14.2% |
$252M |
|
Pork |
-5% |
+56% |
+44% |
+32% |
+24% |
+22.0% |
+17.1% |
$138M |
|
Turkey |
0% |
+72% |
+36% |
+43% |
+23% |
+12.6% |
+18.8% |
$38M |
|
Lamb |
+1% |
+34% |
+8% |
+36% |
+39% |
+31.1% |
+40.5% |
$9M |
|
Exotic |
+5% |
+92% |
+54% |
+61% |
+48% |
+37.6% |
+38.9% |
$3M |
|
Processed |
||||||||
|
Smoked ham/pork |
-6% |
+118% |
+20% |
+63% |
+35% |
+22.4% |
+29.2% |
$16M |
|
Sausage |
0% |
+63% |
+42% |
+35% |
+24% |
+16.5% |
+21.8% |
$125M |
|
Frankfurters |
-1% |
+76% |
+39% |
+20% |
+17% |
+21.7% |
+16.9% |
$63M |
|
Bacon |
-6% |
+54% |
+48% |
+34% |
+18% |
+17.2% |
+23.1% |
$118M |
Source: IRI, Total US, MULO, 1 week % change vs. YA
Market Shifts
Throughout the pandemic, the above average levels of inflation for beef and pork helped boost their dollar share relative to total meat department sales. Beef’s share during the week of July 19 is 3.5 points higher than in early March. But both beef and pork also increased their volume share. Beef increased by about 1.5 points and pork by 1.2 percentage points. Chicken’s share, on the other hand, declined in both dollars and volume. Whereas in early March, chicken had the highest share in pounds, its share during the third week of July is equal to that of beef, at 38.6%. Despite robust gains throughout the pandemic for both lamb and exotic meats, which includes bison, their share of dollars did not change. Exotic meats, however, did see a small uptick in volume share to 0.3%.
|
Share of dollar sales |
Share of volume sales |
|||||
|
Week ending 3/1 |
Week ending 7/19 |
Building calendar year 2019 |
Building calendar year 2020 |
Week ending |
Week ending |
|
|
Beef |
53.3% |
56.8% |
54.2% |
55.5% |
37.0% |
38.6% |
|
Chicken |
27.5% |
24.7% |
26.7% |
25.3% |
40.5% |
38.6% |
|
Pork |
12.9% |
13.5% |
13.6% |
13.6% |
16.5% |
17.7% |
|
Turkey |
4.4% |
3.8% |
4.2% |
4.3% |
4.8% |
4.3% |
|
Lamb |
0.9% |
0.9% |
0.9% |
0.9% |
0.4% |
0.4% |
|
Veal |
0.1% |
0.1% |
0.1% |
0.1% |
0.1% |
0.1% |
|
Exotic |
0.3% |
0.3% |
0.3% |
0.3% |
0.2% |
0.3% |
Source: IRI, Total US, MULO, % of total meat department dollars | “All other” not reflected
What’s Next?
This was the second of a stretch of eight non-holiday weeks until Labor Day, that falls on September 7. Everyday demand is likely to fuel continued double-digit increases for several more weeks as the number of coronavirus cases are rising around the country, and consumer concern along with it. Demand will also be supported by slightly better prices, particularly for beef and pork compared to the past few months.
The renewed restrictions on in-restaurant dining is likely to push both dollar and volume gains well above last year’s levels. Additionally, consumers may continue to divert protein dollars to frozen meat and seafood as well as fresh seafood.
Source: 220 Analytics/IRI
Looking for a reprint of this article?
From high-res PDFs to custom plaques, order your copy today!


