Meat and poultry sales post a strong October; inflation moderating
Eight months into the pandemic, the virus remains in firm control of how and where people spend their food dollar. Restaurant transactions had come within 10% of prior year levels. However, further restaurant comeback is hampered by the rising number of COVID-19 cases combined with restaurants’ outdoor seating capacity being challenged by colder temperatures in northern states. Combined with virtual schooling and working-from home, dollars at retail continued to pace well ahead of 2019 levels during the month of October, at +8.6% for total edibles (food and beverages, including fresh as well as alcohol, grocery and frozen).
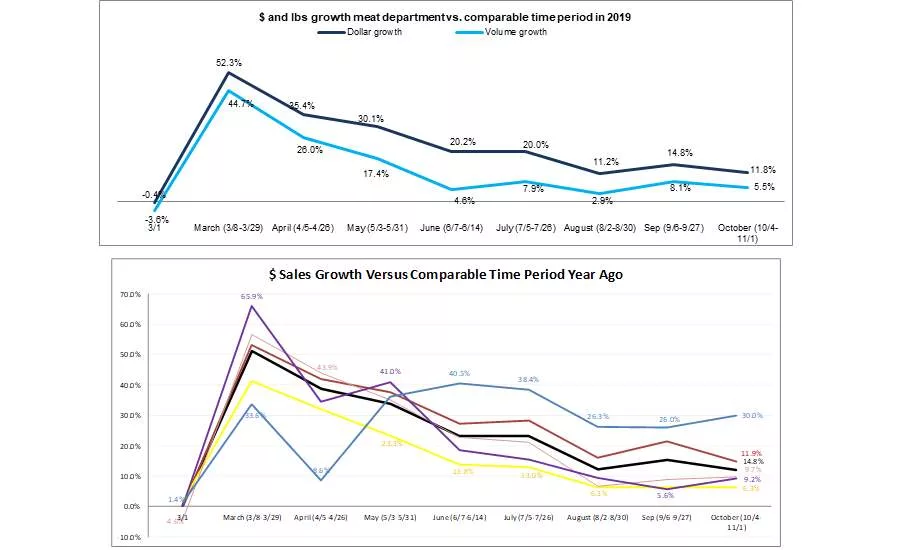
Meat department sales during the week ending October 4 through November 1 increased 11.8% in dollars and 5.5% in volume versus year ago. While this is the lowest dollar gain for any month since March, the volume (pounds) gain of 5.5% is higher than gains in August and June, signaling a strong purchase rate.
Year-to-date through November 1st, overall meat dollar sales are up 18.0% and volume sales have increased 9.0% versus the same period last year. This translates into an additional $11.5 billion in meat department sales during the pandemic, which includes an additional $5.0 billion for beef, $1.5 billion for chicken and $1.0 billion for pork than during the same period in 2019.
Dollar versus Volume Gains
Fresh meat had slightly higher gains in both dollars and volume during the month of October on a larger base. The gap between dollar gains and volume gains dropped further, to 6.3 percentage points during October — the smallest gap since the start of the pandemic purchase patterns.
|
% sales change (October 10/4-11/1) versus year ago |
Dollar gains |
Volume gains |
Volume/dollar gap |
|
Total meat |
+11.8% |
+5.5% |
-6.3 |
|
Total fresh |
+11.9% |
+5.4% |
-6.5 |
|
Total processed |
+11.5% |
+5.8% |
-5.7 |
Source: IRI, Integrated Fresh, Total US, MULO, % gain versus YA
Price per Volume
According to the IRI insights on the price per pound volume, prices continued to drop in favor of the consumer, with an average of $3.85 per volume across all meats during the month of October 2020. This was down 0.5% from the September average of $3.87. However, compared to year ago levels, meat prices were slightly higher in October, at +5.9%.
|
|
Average price per volume |
|||||||
|
|
Mar (3/1-3/29) |
Apr (4/5-4/26) |
May (5/3-5/31) |
Jun (6/7-6/28) |
Jul (7/5-7/26) |
Aug (8/2-8/30) |
Sep (9/6-27) |
Oct (10/4-11/1) |
|
Total meat |
$3.81 |
$3.75 |
$4.02 |
$4.22 |
$4.06 |
$3.96 |
$3.87 |
$3.85 |
|
Total fresh meat |
$3.65 |
$3.71 |
$3.93 |
$4.14 |
$3.92 |
$3.77 |
$3.67 |
$3.64 |
|
Total processed meat |
$4.19 |
$3.83 |
$4.24 |
$4.41 |
$4.39 |
$4.40 |
$4.35 |
$4.36 |
|
Fresh beef |
$5.02 |
$5.32 |
$5.86 |
$6.42 |
$5.68 |
$5.42 |
$5.17 |
$5.14 |
|
Fresh chicken |
$2.43 |
$2.44 |
$2.44 |
$2.48 |
$2.50 |
$2.46 |
$2.41 |
$2.42 |
|
Fresh pork |
$2.87 |
$2.89 |
$3.04 |
$3.14 |
$2.90 |
$2.78 |
$2.73 |
$2.74 |
|
Fresh turkey |
$7.81 |
$7.62 |
$8.45 |
$8.94 |
$8.87 |
$8.63 |
$8.35 |
$8.01 |
|
Fresh lamb |
$8.28 |
$7.98 |
$8.35 |
$8.49 |
$8.52 |
$8.54 |
$8.48 |
$8.51 |
|
Fresh exotic |
$3.15 |
$3.03 |
$3.37 |
$3.41 |
$3.44 |
$3.43 |
$3.43 |
$3.18 |
Source: IRI, Integrated Fresh, Total US, MULO, % gain versus YA
Beef and pork drove much of the inflation in May and June due to supply shortages. Come October, pork prices are a mere 2.1% higher than they were in October 2019 — resulting in pork being among the lowest areas of inflation together with exotic meats. Beef inflation has also moderated significantly, with the average price per volume now 6.4% over year ago levels. Turkey and lamb prices have the highest percentage increase in October 2020 versus year ago.
Assortment
Assortment has nearly completed its comeback after dropping by more than 65 items during some of the tightest supply weeks in May and June. During the month of October, the average number of items per store was 529, which was down 5.7% versus year ago levels.
|
Average items per store selling for week ending… |
|||||||
|
March (3/1-3/29) |
April (4/5-4/26) |
May (5/3-5/31) |
June (6/7-6/28) |
July (7/5-7/26) |
August (8/2-8/30) |
September (9/6-27) |
October (10/4-11/1) |
|
560.2 |
532.1 |
512.4 |
508.2 |
518.4 |
523.2 |
527.0 |
529.0 |
|
-1.1% |
-6.4% |
-10.0% |
-10.7% |
-8.4% |
-6.7% |
-5.8% |
-5.7% |
Source: IRI, Integrated Fresh, Total US, MULO, average items per store selling
Meat Gains by Protein
The meat department has experienced a tremendous pandemic performance and sales continued to be highly elevated across proteins during the month of October. Lamb continued to have the highest percentage gains, at +30.0% versus the same month year ago, but this is off a very small base. Beef’s performance continued to be astounding, up 11.9% during October.
Chicken saw the smallest gains during the months of May through October, with the exception of September when turkey gains dropped below chicken’s.
Beef, by far, had the highest absolute dollar and pound gains during the October weeks, up $279 million in dollars and 31 million in pounds versus year ago. Pork and chicken follow in second and third place.
|
Absolute dollar and volume gains October 2020 vs. same period year ago |
Dollar gains |
Lbs gains |
||
|
TOTAL MEAT |
+$613M |
+11.8% |
+79M |
+5.5% |
|
Fresh |
+414$M |
+11.9% |
+55M |
+5.4% |
|
Beef |
+$279M |
+14.8% |
+31M |
+8.0% |
|
Chicken |
+$58M |
+6.3% |
+7M |
+1.7% |
|
Pork |
+$44M |
+9.7% |
+13M |
+7.4% |
|
Turkey |
+$13M |
+9.2% |
+3M |
+6.6% |
|
Lamb |
+$8M |
+30.0% |
+700K |
+21.5% |
|
Exotic/fowl |
+$1M |
+19.2% |
+87K |
+11.7% |
Source: IRI, Total US, MULO, 1 month % change, week endings October 4-November 1 2020 vs. YA
The Pandemic Sales Performance by Size
Meat department sales were $5.8 billion during the five October weeks — about $613 million higher than the same time period in 2019. On the fresh side, beef accounted for 56% of dollars. Chicken was next at 25% of dollars.
|
2020 $ sales gains versus comparable 2019 period |
||||||||||
|
|
w.e. 3/1 |
Mar |
Apr |
May (5/3-31) |
Jun (6/7-28) |
Jul (7/5-26) |
Aug (8/2-30) |
Sep (9/6-27) |
Oct (10/11/1) |
|
|
TOTAL MEAT |
-0.4% |
+52.3% |
+35.4% |
+30.1% |
+20.2% |
+20.0% |
+11.2% |
+14.8% |
+11.8% |
$5.8B |
|
Fresh |
+0.3% |
+51.1% |
+38.8% |
+33.7% |
+23.2% |
+23.1% |
+12.2% |
+15.2% |
+11.9% |
$3.9B |
|
Beef |
0.0% |
+53.2% |
+42.0% |
+37.5% |
+27.2% |
+28.2% |
+16.0% |
+21.5% |
+14.8% |
$2.2B |
|
Chicken |
+1.8% |
+41.3% |
+32.1% |
+23.3% |
+13.8% |
+13.0% |
+6.3% |
+6.2% |
+6.3% |
$973M |
|
Pork |
-4.6% |
+56.5% |
+43.9% |
+35.0% |
+22.7% |
+21.1% |
+6.7% |
+9.0% |
+9.7% |
$500M |
|
Turkey |
+0.2% |
+65.9% |
+34.4% |
+41.0% |
+18.5% |
+15.5% |
+9.5% |
+5.6% |
+9.2% |
$158M |
|
Lamb |
+5.4% |
+76.5% |
+55.1% |
+59.3% |
+43.3% |
+29.2% |
+18.6% |
+21.9% |
+19.2% |
$34M |
|
Exotic/fowl |
+1.4% |
+33.6% |
+8.6% |
+36.2% |
+40.5% |
+38.4% |
+26.3% |
+26.0% |
+30.0% |
$7M |
Processed meats had a very strong month as well. Hot dogs led percentage growth at +16.2%, but sausage led in absolute dollar gains.
|
2020 $ sales gains versus comparable 2019 period |
||||||||||
|
|
w.e. 3/1 |
Mar |
Apr |
May (5/3-31) |
Jun (6/7-28) |
Jul (7/5-26) |
Aug (8/2-30) |
Sep (9/6-27) |
Oct (10/11/1) |
|
|
TOTAL meat |
-0.4% |
52.3% |
35.4% |
30.1% |
20.2% |
20.0% |
11.2% |
14.8% |
11.8% |
$5.8B |
|
Processed meat |
-1.8% |
55.0% |
29.1% |
23.0% |
14.4% |
14.1% |
9.2% |
13.9% |
11.5% |
$1.9B |
|
Bacon |
-6.4% |
53.3% |
47.4% |
33.8% |
17.9% |
19.2% |
14.5% |
18.8% |
18.2% |
$445M |
|
Dinner sausage |
2.7% |
66.5% |
41.3% |
33.6% |
20.4% |
16.4% |
11.2% |
18.3% |
12.4% |
$327M |
|
Breakfast sausage |
-4.4% |
55.8% |
43.3% |
40.0% |
22.9% |
19.5% |
18.0% |
22.7% |
15.0% |
$151M |
|
Frankfurters |
-0.1% |
75.8% |
39.1% |
20.2% |
12.6% |
14.2% |
9.5% |
26.1% |
16.2% |
$183M |
|
Smoked ham |
-5.3% |
121.8% |
20.1% |
67.3% |
32.1% |
25.9% |
14.4% |
9.9% |
4.2% |
$68M |
|
Processed chicken |
5.1% |
40.2% |
12.9% |
14.1% |
11.6% |
6.9% |
4.4% |
6.8% |
7.1% |
$43M |
|
Packaged lunchmeat |
-4.3% |
47.7% |
19.9% |
9.4% |
5.6% |
5.1% |
2.6% |
5.9% |
6.9% |
$421M |
|
Unsliced RW lunchmeat |
-5.4% |
41.6% |
16.0% |
15.5% |
4.7% |
5.0% |
5.7% |
7.9% |
6.7% |
$3M |
Source: IRI, Integrated Fresh, Total US, MULO, % change vs. YA
Grinds
During October, the dominance of grinds in meat sales continued. Ground beef sales totaled $828 million or 208 million pounds. Ground beef alone added $49.9 million versus year ago levels in October. Altogether, the five grinds listed below generated an additional $972.4 million during the October weeks.
- Ground beef increased 6.4% in dollars and improved 1.9% in volume
- Ground turkey increased 6.0% in dollars and +4.6% in volume
- Ground chicken, +14.9% in dollars and +13.9% in volume
- Ground lamb, +32.8% in dollars and +32.1% in volume
- Ground pork, +6.5% in dollars and +4.6% in volume
What’s Next?
Everyday demand continues to hold between 10% and 15% above year ago levels as new COVID-19 case counts continue to rise and fall in different regions of the country. However, renewed shelter-in-place restrictions and rising COVID-19 cases are likely to push more dollars to food retail once more. Additionally, the comeback of restaurants transactions is hampered by colder temperatures in northern states. Aided by the effect of online sales, trip reduction, virtual schooling and working-from-home, meat sales are likely to remain well above 2019 levels for many weeks to come. However, holiday demand is likely going to be very different.
According to the latest weekly shopper survey wave by IRI, Thanksgiving will involve much less travel and smaller gatherings.
- Just over one-quarter of consumers, 26%, expect to host or attend a Thanksgiving meal with family who do not live with them, down sharply from 48% last year.
- Just 4% will travel out of state to attend a celebration, and only 19% of these people plan to fly.
- The median number of people at the main Thanksgiving meal is expected to be five this year, down from 8 last year.
- One-third expect to spend less on groceries for Thanksgiving this year, primarily due to hosting fewer/no guests this year or having to prepare a meal on a tighter budget. Additionally, 22% of those who plan to spend less will buy a smaller turkey and 15% will not buy a whole turkey.
These predictions point to many potential changes for the meat department. Much like the pandemic-affected holidays to date, packer/processors and retailers may consider messaging and promotions that help shoppers find new ways to make the holidays special at home or on a tighter budget, and retailers should plan for an earlier spike in holiday item purchasing than last year. One in five people plan to shop more than three days earlier than last year, either to avoid crowds or out-of-stocks.
Source: 210 Analytics/IRI
Looking for a reprint of this article?
From high-res PDFs to custom plaques, order your copy today!


