Strength for frozen and fresh seafood persists seven months into 2021
The battle for the food dollar is intensifying as shoppers are ramping up their engagement with restaurants. Whereas in May, the IRI survey of primary shoppers found that 40% had dined inside at a restaurant, come July this share has risen to 50%. At the same time, restaurant takeout (53% of shoppers) and home delivery (21%) are unchanged from their May levels. This coincides with steady fall in the share of meals prepared at home, which shoppers estimate to be an average of 76.6% across meal occasions in July 2021. This is down from 82.0% in July 2020.
Behind the quick rise in on premise dining are summer road trips, making up for all the missed celebrations with friends and family, cooking fatigue but also a return to working away from home. In January of 2021, 45% of shoppers indicated they would not or rarely work from home. Come July 2021, this share has risen to 55%. That means more time pressure for breakfast and dinner as commuting resumes, in addition to more lunches consumed away from home.
Shoppers are not only returning to restaurants but also to the grocery store for in-person trips. In November 2020, 62% indicated they would do all their shopping in store in the coming four weeks. The July 2021 IRI survey found that 71% planned to exclusively shop in-store. The return to in-store shopping is confirmed by the trendline documenting the nature of shoppers’ most recent trip. The in-store trip share was as low as 81% in October 2020 and has increased to 87% in the July survey — taking online trips down to 13%. In addition to more in-store trips, the average time spent in the store rose to a 12-month high at an average of 32.3 minutes.
Trips and Basket Size
Whereas 2020 had many fewer in-store trips, people spent significantly more when they did shop. Come March 2021, that picture reversed. Compared to year ago, total food and beverage trips are trending well ahead of 2020 levels whereas the spend per trip has dropped below the 2020 record levels.
Total Store Year-to-Date Sales
The first 30 weeks of the year, brought $386 billion in food and beverage sales, which was down just 1.1% versus the same period in 2020, though unit sales were down 4.7%. When compared to 2019, dollar sales were up 14.6%. The same pattern holds true for total perishables and frozen items. Frozen foods have the highest increase versus the pre-pandemic normal of 2019, at +22.0%.
|
Year-to-date 2021 through 7/25/2021 |
|
|
% sales change versus year ago |
||
|
Dollar size |
Dollar sales vs. 2020 |
Dollar sales |
Unit Sales vs. 2020 |
|
|
|
Total food and beverages |
$386B |
-1.1% |
+14.6% |
-4.7% |
|
|
Total perishables |
$177B |
-0.2% |
+13.6% |
-3.0% |
|
|
Total frozen |
$38B |
-1.7% |
+22.0% |
-4.0% |
|
Source: IRI, Integrated Fresh, Total US, MULO, % change vs. year ago.
Combined, all these changes point to continued normalization of grocery shopping patterns. IRI and 210 Analytics have teamed up since March 2020 to document the ever-changing marketplace and its impact on frozen, fresh and shelf-stable seafood sales. The report is made possible by the generous support of Elanco.
Seafood Across the Store for the First Seven Months of 2021
Frozen seafood leads year-to-date sales through July 25, 2021, with 30-week sales of $4.3 billion. This was up 1.7% in dollars, but down slightly in units and volume. Fresh seafood sales for the first half of 2021 were a very close second, with gains in dollars, units and volume when compared to the first 30 weeks of 2020. Ambient (canned and pouches) generated about $1.5 billion in the first seven months of the year. Given the high demand for shelf-stable seafood in the early pandemic months of 2020, this is down about 13% across dollars, units and volume.
|
First seven months of 2021: January - July |
|
% sales change versus year ago |
||
|
Dollar size |
Dollar sales |
Unit sales |
Volume sales |
|
|
Frozen seafood |
$4.32B |
+1.7% |
-1.0% |
-2.3% |
|
Fresh seafood |
$4.29B |
+7.2% |
+2.5% |
+2.3% |
|
Ambient (shelf-stable) seafood |
$1.5B |
-13.5% |
-13.1% |
-14.7% |
Source: IRI, Integrated Fresh, Total US, MULO, % change vs. year ago.
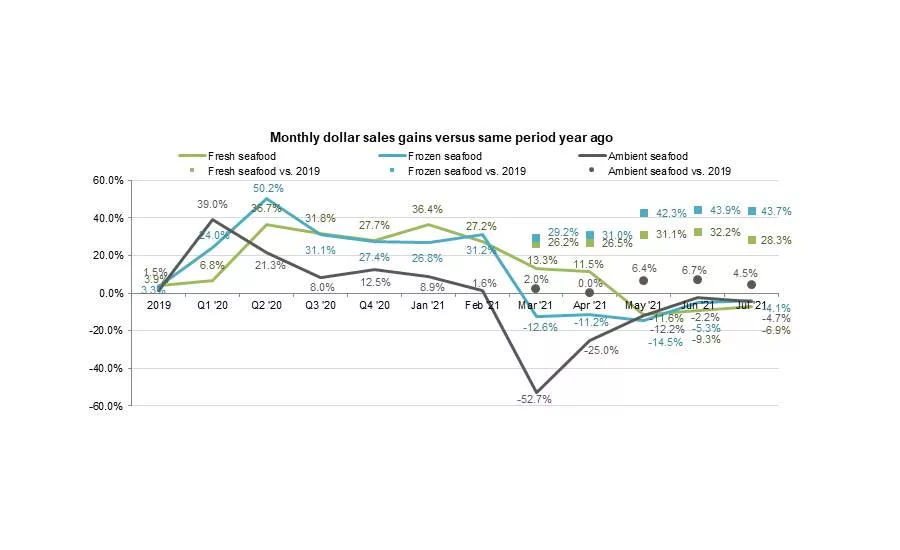
Month-by-month, all three areas continue to sit slightly below 2020 levels, but are tracking far ahead of the July 2019 results.
Ambient Seafood in July 2021
July brought strong shelf-stable seafood (cans and pouches) sales, driven by tuna. While down slightly from the 2020 results, the $197 million in sales reflects an increase of 4.5% versus 2019. Ambient seafood has consistently outperformed the 2019 pre-pandemic base line between March and July 2021. Shelf-stable salmon, while much smaller, sees dollar sales up 13.3% over 2019.
|
|
|
% sales change versus year ago |
|||
|
Dollar size |
Dollar sales vs. 2020 |
Dollar sales vs. 2019 |
Unit Sales vs. 2020 |
Volume Sales vs. 2020 |
|
|
Ambient (shelf-stable) seafood |
$197M |
-4.7% |
+4.5% |
-7.2% |
-4.5% |
|
Ambient tuna |
$147M |
-5.3% |
+0.7% |
-8.2% |
-4.2% |
|
Ambient salmon |
$18M |
-7.3% |
+13.3% |
-7.6% |
-12.5% |
|
Ambient clams |
$3M |
-11.6% |
+18.4% |
-12.6% |
-14.8% |
Source: IRI, Integrated Fresh, Total US, MULO, % change vs. year ago.
Fresh Seafood
Sales during the Fourth of July holiday week were, by far, the strongest, at $152 million. This was down double digits from 2019, but up 18.5% versus the pre-pandemic normal of 2019.
Sales in the subsequent July weeks dropped a little each week, but that is the normal July pattern, as meat takes center stage during backyard barbecue occasions. As such, dollar sales got very close to 2020 levels by the end of July and far exceeded each of the July 2019 weeks.
July marks the third month that fresh seafood, including finfish and shellfish, fell below year ago levels. At -0.5%, fresh finfish came in the closest to year-ago sales levels and all three areas are tracking well ahead of 2019.
Sales for finfish were slightly higher than shellfish, at $298 million versus $244 million. Finfish also had the better dollar and volume performance when comparing sales to year ago. However, this picture is somewhat skewed due to the enormous strength of shellfish throughout 2020. When compared to 2019, it is shellfish that leads all growth at +36.2% versus the pre-pandemic normal and +21.0% for finfish. This is a clear illustration that fresh seafood continues to enjoy very strong demand over typical levels, even if the year-over-year view is negative.
|
July 2021 |
|
% sales change versus year ago |
||
|
Dollar size |
Dollar sales |
Unit sales |
Volume sales |
|
|
Total fresh seafood |
$568M |
-6.9% |
-10.8% |
-13.6% |
|
Fresh finfish |
$298M |
-0.5% |
-6.9% |
-7.5% |
|
Fresh shellfish |
$244M |
-15.4% |
-16.6% |
-21.7% |
Source: IRI, Integrated Fresh, Total US, MULO, % change vs. year ago (not shown: other items in the seafood department)
Retailers continue to invest in a broader fresh seafood assortment, especially in finfish. The average number of fresh seafood items per week per store increased by 1.1% in July 2021 versus the same month in 2020.
|
Items/store |
2019 |
Q1 ‘20 |
Q2 ‘20 |
Q3 ‘20 |
Q4 ‘20 |
Q1 ‘21 |
Q2 ‘21 |
Jul ‘21 |
Jul vs ‘20 |
|
Total fresh seafood |
40.6 |
42.2 |
40.1 |
42.4 |
42.8 |
43.7 |
42.3 |
42.8 |
+1.1% |
|
Fresh finfish |
20.6 |
21.5 |
20.8 |
21.9 |
21.8 |
22.5 |
22.3 |
22.7 |
+3.4% |
|
Fresh shellfish |
16.8 |
17.1 |
16.5 |
16.8 |
17.4 |
17.6 |
17.0 |
16.6 |
-1.4% |
Source: IRI, Integrated Fresh Total US, MULO, average weekly items per store selling
Salmon Accounts for a Third of All Fresh Seafood Sales and Yet Continues to Grow
Salmon is, by far, the biggest seller within fresh seafood, with July sales of $568 million. This reflects a 28.3% increase versus the pre-pandemic normal of 2019, and an 0.7% increase versus year ago. Four other areas managed a year-over-year increase, which were shrimp, tilapia, cod and seafood/crab cakes.
|
Fresh seafood |
2019 |
Q1 ‘20 |
Q2 ‘20 |
Q3 ‘20 |
Q4 ‘20 |
Q1 ‘21 |
Q2 ‘21 |
Jul ‘21 |
Jul vs ‘20 |
Jul vs ‘19 |
|
Total fresh seafood |
+3.9% |
+6.8% |
+36.7% |
+31.8% |
+27.7% |
+27.1% |
-4.1% |
$568M |
-6.9% |
+28.3% |
|
Salmon |
+6.3% |
+10.5% |
+23.3% |
+19.1% |
+28.1% |
+17.2% |
+2.3% |
$190M |
+0.7% |
+21.7% |
|
Crab |
+13.4% |
+14.0% |
+17.8% |
+88.2% |
+47.1% |
+60.8% |
-18.1% |
$100M |
-23.4% |
+58.0% |
|
Shrimp |
-1.3% |
-1.6% |
+19.9% |
+17.2% |
+11.0% |
+20.3% |
-1.4% |
$82M |
+0.9% |
+22.1% |
|
Lobster |
-3.4% |
+2.3% |
+87.5% |
+65.5% |
+66.5% |
+84.6% |
-21.1% |
$36M |
-21.8% |
+28.8% |
|
Catfish |
+5.9% |
+7.3% |
+36.7% |
+28.2% |
+26.9% |
+11.5% |
-15.5% |
$18M |
-6.2% |
+26.8% |
|
Tilapia |
-2.6% |
+5.0% |
+23.9% |
+16.9% |
+14.5% |
+2.4% |
-12.4% |
$17M |
+0.5% |
+21.6% |
|
Cod |
-0.1% |
+0.4% |
+6.1% |
+7.8% |
+13.8% |
+10.7% |
+2.8% |
$16M |
+1.0% |
+14.2% |
|
Scallop |
-0.9% |
-0.6% |
+12.5% |
+10.7% |
+17.3% |
+23.9% |
-16.9% |
$9M |
-34.9% |
-9.1% |
|
Tuna |
+9.3% |
+11.2% |
+5.3% |
+25.7% |
+30.7% |
+29.3% |
+24.1% |
$9M |
-0.5% |
+21.8% |
|
Seafood cakes |
+2.3% |
+14.3% |
+35.0% |
+41.4% |
+44.6% |
+44.7% |
+20.9% |
$7M |
+6.6% |
+54.0% |
Source: IRI, Integrated Fresh Total US, MULO, % increase in $ growth versus year ago
Frozen Seafood Sales
Frozen seafood has been a growth leader across frozen food offerings month after month. Both in 2020 and the first half of 2021, sales have grown because of more people buying frozen seafood, people buying it more often and spending a little more per trip. In July 2021, frozen seafood sales totaled $557 million, the highest of all frozen protein offerings. This constitutes a 44% increase over the 2019 normal.
By cut, frozen fish was the largest category in July, at $243 million. The second-largest segment, frozen raw shrimp, was up the most in comparison to pre-pandemic levels, at an unbelievable +61.9%.
|
|
2019 |
Q1 ‘20 |
Q2 ‘20 |
Q3 ‘20 |
Q4 ‘20 |
Q1 ‘21 |
Q2 ‘21 |
Jul ‘21 |
Jul vs ‘20 |
Jul vs ‘19 |
|
Frozen seafood |
+5.1% |
+19.8% |
+55.8% |
+42.2% |
+32.7% |
+17.7% |
-10.4% |
$557M |
-4.1% |
+43.7% |
|
Frozen fish/ seafood |
+4.0% |
+21.7% |
+51.5% |
+41.0% |
+35.7% |
+11.9% |
-10.1% |
$243M |
-3.2% |
+42.0% |
|
Frozen raw shrimp |
+8.2% |
+22.0% |
+71.5% |
+57.5% |
+46.9% |
+37.4% |
-8.2% |
$177M |
-5.5% |
+61.9% |
|
Frozen cooked shrimp |
+4.0% |
+14.2% |
+47.0% |
+28.1% |
+15.9% |
+9.1% |
-13.6% |
$137M |
-3.8% |
+27.8% |
Source: IRI, Integrated Fresh, Total US, MULO, % change vs. year ago.
What’s Next?
August will be an interesting test case relative to the normalization of the marketplace thus far in 2021 as the Delta variant of the COVID-19 virus is prompting an increase of new COVID cases across the country. In the past few months, the normalization of shopping patterns including a return to in-store shopping, spending more time as well as on-premise restaurant dining, has been driven by vaccinated Americans. The August sales and survey results relative to retail and foodservice sales will interesting to watch as we close out the summer.
As of yet, most school districts are planning to resume in-person education. Consumers are expecting back-to-school spending to be big this year. The July IRI survey found that 51% of parents expect they will spend more this year than they did last year in addition to 38% believing they will spend about the same.
Of parents shopping for back-to-school items, 47% believe they will do most or all in-store and 38% expect they will spend equally in-store and online. That provides grocery retailers with an important opportunity to draw people to the store as they prepare for the upcoming school year.
Source: 220 Analytics
Looking for a reprint of this article?
From high-res PDFs to custom plaques, order your copy today!


