Earlier Easter challenges April meat department sales
Deceleration in the rate of inflation influences market.
The April marketplace
The deceleration of the rate of inflation continued in April 2023. After many months of double-digit increases, insights firm Circana (formerly IRI) found that the average price per unit for total food and beverages increased by 8.2% in April 2023 compared with April 2022. At the same time, this is 23.1% above the April 2020 levels — illustrating that inflation continues to take a big bite out of American households’ paychecks. Additionally, the temporary Supplemental Nutrition Assistance Program (SNAP) emergency allotments (EAs) — a temporary benefit increase that Congress enacted to address rising food insecurity and provide economic stimulus during the COVID-19 pandemic — ended in March 2023. The average SNAP recipient person receives about $90 a month less and households receive at least $95 less up to reductions of $250 per month. Circana and 210 Analytics continue to track the marketplace challenges on meat department sales and trends. The April report is made possible by Hillphoenix.
Per the April Circana survey of primary grocery shoppers:
- The consumer-estimated share of meals prepared at home rose to 80%, with above average shares for lower-income and fixed-income shoppers.
- 22% of consumers plan to source fewer restaurant meals. Restaurant takeout (50% of consumers in the past month) continues to see higher engagement than on-premise dining (48%). At the same time, 19% of consumers plan to cook more meals from scratch.
- When buying groceries, a survey high of 85% of consumers apply one or more money-saving measures, led by looking for sales promotions (53%), cutting back on non-essentials (46%) and buying store brands more often (34%).
- Consumers are also changing behaviors inside the home, per the Circana survey. Forty percent of consumers say they are more conscious of using up fresh foods before they go bad, 39% are using leftovers more and 25% are using more simple ingredients. Sixteen percent say they are buying frozen foods to enable them to use as much as needed for a meal.
Inflation insights
The price per unit across all foods and beverages in the Circana-measured multi-outlet stores, including supermarkets, club, mass, supercenter, drug and military, increased by 8.2% in April (the four weeks ending 4/30/2023), which was down from 11.4% in the first quarter of the year.

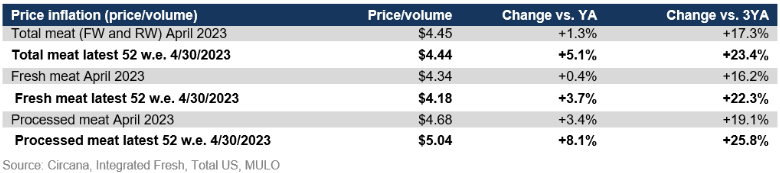
The average price per pound in the meat department across all cuts and kinds, both fixed and random weight, stood at $4.45 in April 2023. Prices only increased slightly year-on-year, at +1.3% — continuing a trend of moderating levels. Looking at the full 52 weeks ending April 30th, the average price per pound across all meat and poultry was virtually the same, at $4.44.
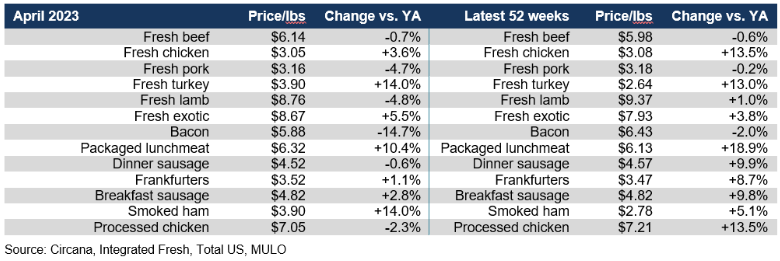
By protein, April prices decreased for beef, pork, lamb, bacon, dinner sausage and processed chicken. Bacon prices were down by double digits in April 2023 compared to April last year. Only turkey and packaged lunchmeat had double-digit inflation, whereas price increases in chicken have started to moderate.
Meat sales
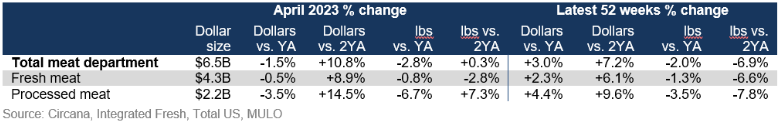
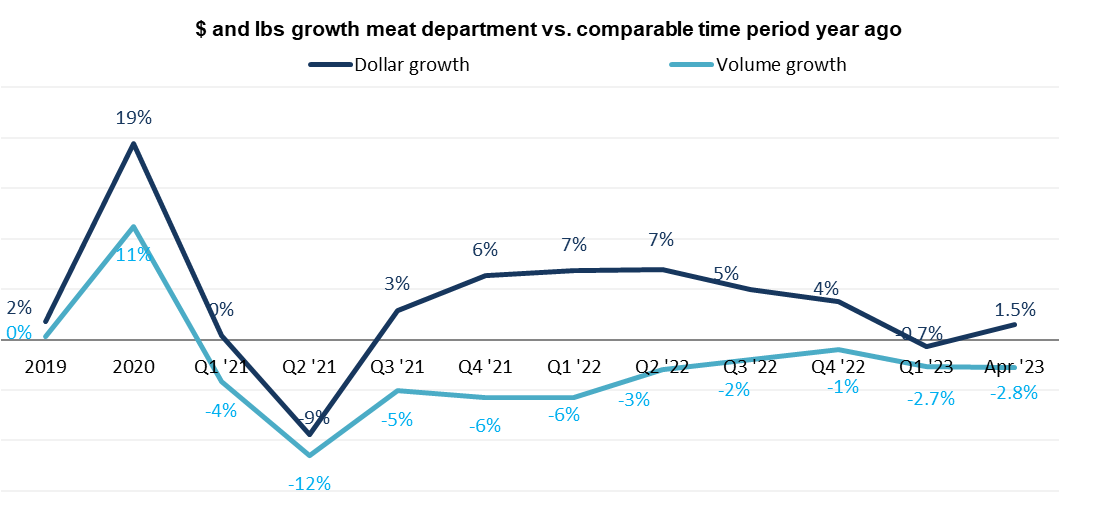
In April, the very mild inflation in the meat department was unable to offset a 2.8% decline in pound sales, resulting in a 1.5% decline in dollar sales. On an annual basis, meat sales still tracked 7.2% ahead in dollars and pounds were 2% below the prior year level.
Volume sales trends appeared to be on a path of recovery in 2022. However, recovery stalled in the fourth quarter of 2022 and year-on-year volume sales dipped deeper into the negative in the first quarter and April of 2023.
 Assortment
Assortment, measured in the number of weekly items per store averaged 494 meat and poultry SKUs in April 2023. Levels are holding steady against the 2022 averages, but remain down substantially against 2019.

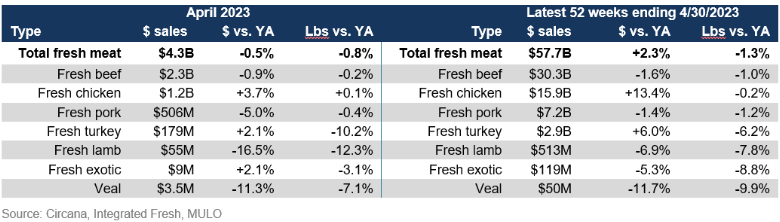
Fresh meat sales by protein
In all, the combination of mild inflation with subdued volume pressure prompted a -0.5% decrease in fresh meat sales in April 2023 versus April 2022. Beef was the biggest seller and sales were virtually flat compared to last year. Lamb had a strong March but sales fell behind year-ago levels in April, likely at least in part influenced by the difference in Easter/Passover timing between 2022 and 2023 when Easter was one week earlier.
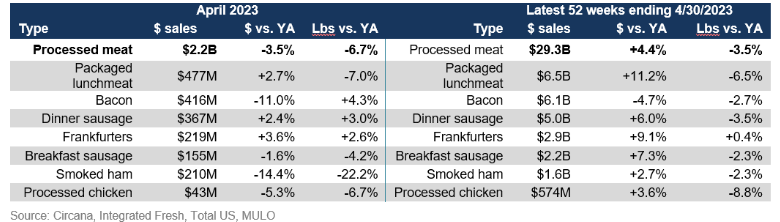
Processed meat
The impact of the earlier Easter that likely pushed some of the holiday sales into March can also be seen in smoked ham sales. In April, smoked ham volume was down more than 22%, whereas the full-year sales were off by a mere 2.3%. Everyday items, such as bacon, dinner sausage and frankfurters experienced increases in pound sales, which may bode well for May sales.
In the 52-week view, dollar sales did remain ahead of year ago levels, but pound sales trailed by 3.5%. Frankfurters were the only processed meat item that grew pound sales, at +0.4%.
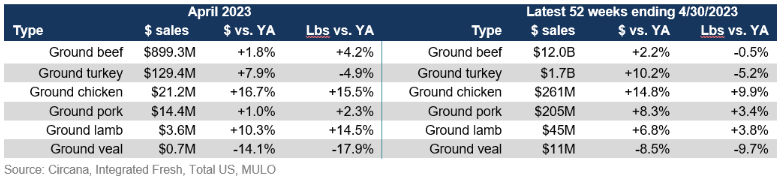
Grinds
In the past year, grinds generated $12.0 billion, with 85% of dollars and pounds being generated by ground beef. The ground beef performance exceeds that of total beef, with a year-on-year pound increase of 4.2% in April 2023 when compared to April 2022 sales. Additionally, ground chicken, pork and lamb gained in pounds in April as grinds bring affordability and versatility to the meat department.
What’s next?
In an update from last month’s survey, the April Circana survey outlook for Memorial Day found growing enthusiasm for the kick off of grilling season:
- 54% of consumers believe they will do something special for Memorial Day, led by getting together with friends and family (32%), cookouts (30%), outdoor activities, travel, parties and more.
The work-from-home landscape continues to change as well. Having peaked at half of the population at the onset of the pandemic, the share of people who work from home one or more days per week is down to 25% of consumers or 46% of those who are active in the workforce.
The next performance report in the Circana, 210 Analytics and Hillphoenix series will be released mid-June 2023 to cover the May sales trends.
Please thank the entire meat and poultry industry, from farm to store, for all they do.
Date ranges:
2019: 52 weeks ending 12/28/2019
2020: 52 weeks ending 12/27/2020
2021: 52 weeks ending 12/26/2021
2022: 52 weeks ending 1/1/2023
Q4 2022: 13 weeks ending 1/1/2023
Q1 2023: 13 weeks ending 4/2/2023
March 2023: 5 weeks ending 4/2/2023
April 2023: 4 weeks ending 4/30/2023
Looking for a reprint of this article?
From high-res PDFs to custom plaques, order your copy today!


