The Crop Report 2023: Second half of 2023 will continue to challenge producers
Prices and transportation costs will remain very volatile

Photo Credit: Minnesota Corn Growers Association
In the protein business, feed ingredients are over 50% of our cost. No two years in farming are alike or free of drama. Much can change between now and the harvest, The key is bringing order to chaos and having a long-term strategy.
This year there has been a dramatic reduction in carryover. The dry spell has spanned the wheat fields of the Great Plains and the Corn Belt in the Upper Midwest, leaving areas with fractions of their normal rainfall as they head into crucial growing periods for corn and soybeans. La Niña is on the way out and El Niño is on the way in, an advisory was issued, with a 56% chance for a strong El Niño to develop this coming winter. **
This year's corn and soybean meal prices will be higher than average, with protein supply in excess this is an unprofitable combination. The abundant crop harvest in Brazil is also a factor. Additional unusual global consumption patterns in 2022 further eroded carry over supplies. If there are any key issues such as continued lack of rain in July, we could have an even more severe situation, because the market does not have the usual supply carryover to cushion an event. The fear is a repeat of a drought-stricken 2012 that sent crop prices surging. The next three to four weeks are going to be huge. We recently saw significant foreign soybeans imports to the U.S., Global feed prices are expected to continue declining, with projected costs for 2023 estimated to be 10% to 15% lower than the historic highs of 2022 ***
The Ukrainian effect: the grain agreement initially signed in 2022, allowing grain exports from Ukrainian ports in the Black Sea. On May 17, 2023, when the deal was last set to expire, it wase extended for two more months. The war continues to be a major disruption. Ukraine now ranks fourth, contributing more than 15% of world corn exports and 10% of wheat exports. Potash is a key ingredient in fertilizer. Russia/Belarus mines produce:38 % of the world’s potash. Long term, an extended disruption could result in a significant reduction in fertilizer use globally, resulting in a reduction in yield. The long-term result will be famine and starvation in certain parts of the world. To date Canadian potash mines have exceeded U.S. demand.
We continue to express long-term concerns about our farmers and their ability to continue supplying the feed ingredients we need on a cost-effective basis. Around 70% of the farmland is going to change hands in the next 15 years. This means the next generation of farmers need to take control and continue to produce the crops we need to feed our animals and supply ingredients for our baked goods. Venture and hedge funds are buying and operating large farms. Additionally, experts are genuinely concerned that we continue to lower our water tables and 10 years from now will have significant challenges with the water supply. Areas of the U.S. are facing significant water stress such as Nebraska, Colorado, California, Delaware, Ohio, Virginia, North Carolina, Arkansas and the entire Southwest. As an industry we need to improve our stewardship of water use, returning it back into supply in the form of potable water. We also need to protect adjacent waterways.
Corn
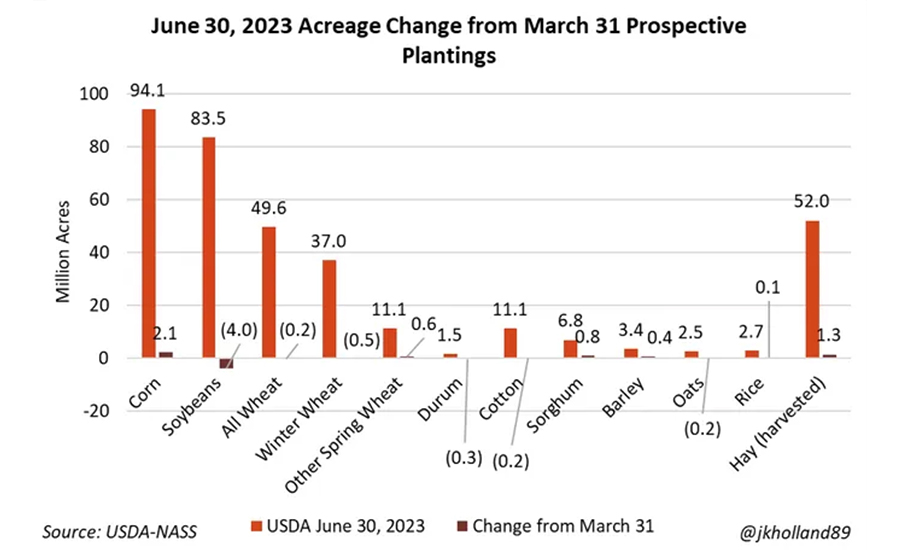
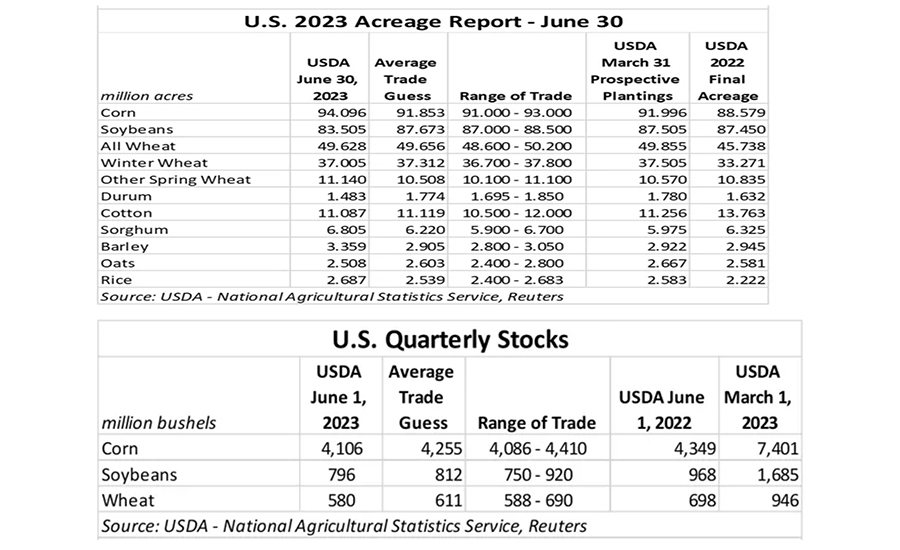
The U.S. Department of Agriculture also came in higher than expected on corn acres, with 94.1 million acres expected to be planted this spring, a million more acres than the highest pre-report market estimate. new estimate for corn acres shocked analysts after jumping 6% higher year-over-year to 94.1 million acres – an increase of 5.52 million acres versus 2022. That was also more than 2 million acres above the average trade guess of 91.853 million acres. It is also the third-most corn planting since 1944.
Quarterly corn stocks moved from 7.401 billion bushels at the beginning of March down to 4.106 billion bushels through June 1. It is also below year-ago results of 4.349 billion bushels. Analysts were expecting a larger total, with an average trade guess of 4.255 billion bushels, although individual estimates ranged between 4.086 billion and 4.410 billion bushels. Usage data for all three commodities between March 1 and June 1, 2023, was much larger than the markets had been anticipating, which gave all three commodities a price bump. But then USDA released acreage data and Stocks Report.
Soybean
USDA’s June 30 Acreage Report caught everyone by surprise, especially the soybean markets. USDA’s count of 83.5 million acres of U.S. soybeans planted in 2023 was so far off everyone’s radar that it sent nearby July 2023, USDA lowered U.S. soybean acres by 5% versus 2022, with just 83.5 million acres. Acreage is steady or lower in 21 of the 29 estimated states. It was also noticeably below the average trade guess of 87.673 million acres. Total planted oilseed area is almost 1.2% lower than last year, with smaller soybean and sunflower acreages driving the decline, Quarterly soybean stocks also shifted lower, moving from 1.685 billion bushels in March down to 796 million bushels through June 1. That was lower than both year-ago totals of 968 million bushels and the average trade guess of 812 million bushels. Individual analyst estimates ranged between 750 million and 920 million bushels.
The hopes of the renewable diesel boom fizzled earlier for farmers than the market realized, despite more capacity coming online this year. Soybean crush capacity has been expanding since 2021, but most of the expansion will take place from 2023 through 2027 with the addition of 620 million bushels by the 2026-27 crop year. A 30% increase from the US Department of Agriculture’s forecast soybean crush of 2,220,000 bus in 2022-23. ***
Wheat
All-wheat acres were close to the average analyst estimate of 49.656 million acres, with USDA offering a slightly lower total of 49.628 million acres. Also, a year-over-year increase of 9%. The total is comprised of 25.7 million acres of hard red winter, 7.66 million acres of soft red winter, 3.68 million acres of white winter, 11.1 million acres of spring wheat and 1.48 million acres of durum wheat. Quarterly wheat stocks eroded from 946 million bushels in March down to 580 million bushels through June 1. That was modestly lower than the year-ago-totals of 698 million bushels and was also below the entire range of trade guesses, which came in between 588 million and 690 million bushels.
US wheat exports have declined for decades to the point that the United States is considered a residual supplier to the global market with Russia the top wheat exporter. Brazil has overtaken the United States as the world’s largest soybean exporter, with China, the world’s largest soybean importer, indicating it favors to do business with Brazil. The United States remains the world’s largest corn exporter by far, but Brazil also is making inroads in that sector with recent record-high corn production and exports. ***
Along with soybeans, the share of domestic demand for corn and wheat is expected to increase in the coming years, resulting in lower exports. The US share of global export markets will decrease due to growing domestic demand, especially for soybeans. This is also the result of ever-increasing crops in South America, large Russian wheat production, and high US prices compared to export competitors. We expect global market uncertainty to be constant against stable, and potentially increasing domestic demand. Domestic demand is becoming less sensitive to prices, based on 10-year averages of commodity prices. *** If you follow a five-year trend, grain-based feed ingredients including corn, wheat, and soybeans prices travel within a pricing range of one another. Their price also correlates to the price of oil. Estimating and gaining control over that cost is always a factor in a successful or unsuccessful year for good companies in the protein business. Ethanol production continues to get more efficient, maximizing the energy extracted from every bushel of corn. Ethanol is now the number one consumer of corn with animal feed ingredients close behind in second. Crude oil markets are back into the $75 per barrel range caused by OPEC moderating production, Russian disruptions, and a recent increase in consumption.
Looking ahead
Prices and transportation costs will remain very volatile as the global situation continues to evolve. Because of superior farming technology and the ingenuity of the American farmer, we are projecting a good harvest this year. Yield may be affected by drought and the reduction in the use of fertilizer and crop inputs by thrifty farmers. Global politics will continue to influence our cost structure and our ability to deliver products cost-effectively to our customers. By limiting the supply, analysts with the financial services company report an economic downturn would affect poultry market conditions. With ongoing high inflation pressuring consumer spending power, and operational issues, the second half of 2023 will continue to challenge producers. Global markets are expected to stay strong in 2023, with global poultry demand expected to benefit from consumers trading down to cheaper protein. However, global economic growth is expected to fall, while inflation is expected to stay high.
Dan Emery is CEO of Meaningful Solutions and a member of The National Priovisioner’s Editorial Board.
Sources
* June 30, 2023, The U.S. Department of Agriculture's National Agricultural Statistics Service (NASS)
** https://www.climate.gov/news-features/blogs/how-do-noaa-scientists-predict-annual-global-temperature-ranking-ahead-time
*** RaboResearch Food & Agribusiness in its recent “The Mighty US Crop Markets Through 2030
Looking for a reprint of this article?
From high-res PDFs to custom plaques, order your copy today!


