Meat gains soften a bit on single-digit chicken and turkey gains
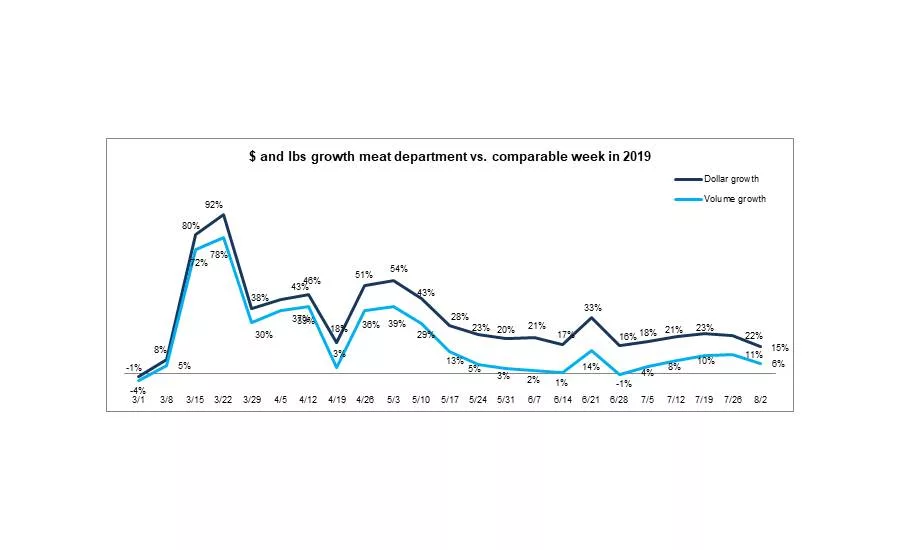
Five months into the pandemic, 57% of primary grocery shoppers were extremely concerned about COVID-19, according to wave 16 of the IRI sentiment survey. The concern is driving continued elevated spending in food retail, while also hampering the recovery of foodservice. The survey, conducted July 24 to 26, found that 30% of primary grocery shoppers are experiencing greater financial pressure than last year and 25% are buying more value-size items to save money, up from 20% in late May. Additionally, 65% of consumers expect the economic crisis to last at least 12 more months — the highest percentage across all survey waves and near double that of the 37% who expected the economy to need a year to recover back in March. Economic pressure tends to have big impacts on grocery shopping, including channel choice, the type of items and quantity bought, the importance of price and promotions and more. Meat sales may have also been impacted in preparation for hurricane/tropical storm Isaias that left several hundred thousand consumers without power along the East coast. Much like seen the last week of June, the final days of July/early August saw some softer gains than those seen in the prior two weeks.
The net result for the meat department was a double-digit gain in dollars, at +15.4% during the week ending August 2 versus the comparable week year ago. While hard to believe, this marks the lowest year-over-year gain since the onset of the pandemic purchasing starting March 15, and yet, the 21st week of double-digit year-over-year gains. Dollars sales gains in hard-hit hurricane areas were just +8.4% for Connecticut, where 145,000 households remain without power as of August 9, and New York sales grew 9.9% — both well below average.
Volume gained 6.0% as prices continued to become a little more favorable to consumers — which also erodes dollar gains somewhat. At an average of $3.87 during the week of August 2nd, prices have dropped $0.29 per pound since the peak of $4.16 the third week of June.
So far during the pandemic, starting March 15 through August 2, dollar sales are up 33.7% and volume sales have increased 20.7% versus the same period last year. This translates into an additional $8.1 billion in meat department sales during the pandemic, which includes an additional $3.7 billion for beef, $1.1 billion for chicken and $851 million for pork. Unit sales continue to do well, with 10.5 million more transactions compared with same week year ago and 852 million more transactions since the pandemic began.
Dollar versus Volume Gains
The total meat volume/dollar gap narrowed to single digits for the first time since the week of April 12. The volume/dollar gap was 19.1 percentage points at its widest in June. Fresh meat (+15.4%) dollar gains were slightly stronger than processed meat (+14.6%). Fresh meat volume gains exceeded processed meat as well.
| Latest 1 week ending August 2, 2020 versus comparable week in 2019 | Dollar gains | Volume gains |
Volume/dollar gap (percentage points) |
| Total meat | +15.4% | +6.0% | -9.4 |
| Total fresh | +15.6% | +6.4% | -9.2 |
| Total processed | +14.6% | +4.6% | -10.0 |
Source: IRI, Total US, MULO, 1 week % gain versus YA
The volume/dollar gap is still in double digits in the longer, four-week look ending August 2. However, the four-week gap narrowed from 13.0 percentage points to 11.9 points — signaling prices continue to come down. The longer view shows double digit gaps for beef and lamb, but pork has narrowed to just 7.0 points, now lower than chicken. Fresh exotic meats, including bison, is the only area that saw volume gains trending ahead of dollar gaps, creating a positive gap, at +3.4 points. Pricing for bison and other exotic meats has been very steady throughout the pandemic. In the one-week look, only beef is still in double-digits.
| Latest 4 weeks ending August 2, 2020 versus comparable weeks in 2019 | 4-week dollar gains | 4-week volume gains | 4 week volume/dollar gap (points) | 1 week volume/dollar gap (points) |
| Total meat | +20.6% | +8.7% | -11.9 | -9.4 |
| Fresh beef | +26.8% | +11.6% | -15.2 | -11.6 |
| Ground beef | +20.1% | +5.4% | -14.7 | -11.6 |
| Fresh chicken | +11.2% | +3.6% | -7.6 | -5.1 |
| Fresh pork | +18.1% | +11.1% | -7.0 | -2.6 |
| Fresh turkey | +14.2% | +9.3% | -4.9 | -7.8 |
| Fresh lamb | +37.8% | +26.6% | -11.2 | -9.7 |
| Fresh exotic | +35.9% | +39.3% | +3.4 | +4.4 |
| Fresh veal | +17.2% | +15.3% | -1.9 | 0.0 |
| Smoked ham/pork | +23.1% | +21.0% | -2.1 | 9.4 |
| Sausage | +18.4% | +11.6% | -6.8 | 7.3 |
| Frankfurters | +17.3% | +1.8% | -15.5 | -4.6 |
| Bacon | +19.6% | +12.0% | -7.6 | 8.4 |
Source: IRI, Total US, MULO, 4 weeks ending August 2, 2020 versus YA
Assortment
The number of items continued to rebound to an average of 320 items per store during the week ending August 3. With non-holiday weeks typically offering fewer items, this average is down about 20 items from prior year levels. While assortment has vastly improved, lack of items continued to impact shopper satisfaction. “With the virus counts back up in our area, I try to only go to the store once. Because I work, that has to be in the evenings or weekends and more often than not, the selection is scarce. Would be nice to have at least basics in stock.”
| Average weekly items per store selling for week ending… | ||||||
| March (3/1-3/29) | April (4/5-4/26) | May (5/3-5/31) | June (6/7-6/28) | July (7/5-7/26) | 7/26 | 8/2 |
| 332 | 315 | 301 | 304 | 317 | 319 | 320 |
Source: IRI, Total US, MULO, average weekly items per store selling
Price
The Retail Feedback Group’s Constant Customer Feedback (CCF) system continued to capture price-related comments. One shopper wrote, “Meat is so high priced. Since COVID it seems all prices went sky high.” Another shopper noted, “Would like to see some better meat specials, not just frozen meat. It does seem prices are getting better.” IRI insights on the price per volume shows prices are indeed still elevated but coming down.
|
Average price per volume versus the same period year ago |
1 week ending August 2 | 4 weeks ending August 2 | |||
| Average | Change vs. prior period |
Change vs. YA |
Average | Change vs. year ago | |
| Total meat | $3.87 | -0.4% | +8.9% | $3.93 | +10.9% |
| Fresh beef | $5.59 | -0.7% | +10.7% | $5.66 | +13.6% |
| Ground beef | $4.28 | +0.9% | +11.7% | $4.35 | +14.0% |
| Fresh chicken | $2.44 | -2.1% | +4.9% | $2.49 | +7.3% |
| Fresh pork | $2.73 | -2.6% | +2.4% | $2.86 | +6.3% |
| Fresh turkey | $3.47 | +2.1% | +7.8% | $3.42 | +4.4% |
| Fresh lamb | $8.61 | -1.0% | +8.0% | $8.50 | +8.9% |
| Fresh exotic | $4.23 | +2.0% | -3.2% | $4.29 | -2.4% |
Source: IRI, Total US, MULO, 1 week and 4 weeks ending August 2, 2020
Versus the same week year ago, the average price per volume for the total meat department during the week of August 2 was up 8.9% — the first time it has hit single digits since April. The average of $3.87 is down 0.4% from the week prior, with significant decreases for chicken and pork.
Meat Gains by Protein
The week of August 2, two proteins fell back to single-digit gains, chicken and turkey. For turkey, this was the first time since the week of April 19, which went up against Easter 2019, that year-over-year gains were in single digits. Gains for all proteins were lower than those seen in the previous two weeks.
The Pandemic Sales Performance by Area
Meat department sales were $1.28 billion during the week of August 2 — about $20 million less than the week prior. Exotic meat, including bison, had the strongest gains, at +31.6%. Beef accounted for 53.9% of the $171 million in new meat department dollars this week. This is more than five times the additional dollars generated by the number two, chicken, that contributed 10.2%, or +$17 million versus year ago.
| 2020 Weekly $ sales gains versus comparable 2019 week ending… | $ | |||||||||||
| 3/1 |
March (3/8-3/29) |
April (4/5-4/26) |
May (5/3-5/31) | June (6/7-6/28) | July (7/5-7/26) | 7/26 | 8/2 | 8/2 | ||||
| TOTAL MEAT | -1% | +54% | +38% | +32% | +22% | +21% | +22.2% | +15.4% | $1.28B | |||
| Fresh | ||||||||||||
| Beef | 0% | +53% | +42% | +36% | +27% | +28% | +26.8% | +20.2% | $549M | |||
| Chicken | +1% | +41% | +32% | +21% | +13% | +12% | +14.0% | +7.9% | $240M | |||
| Pork | -5% | +56% | +44% | +32% | +24% | +21% | +21.2% | +12.3% | $127M | |||
| Turkey | 0% | +72% | +36% | +43% | +23% | +17% | +17.1% | +8.6% | $36M | |||
| Lamb | +1% | +34% | +8% | +36% | +39% | +39% | +49.5% | +30.6% | $8M | |||
| Exotic | +5% | +92% | +54% | +61% | +48% | +36% | +35.7% | +31.6% | $3M | |||
| Processed | ||||||||||||
| Smoked ham/pork | -6% | +118% | +20% | +63% | +35% | +26% | +25.1% | +16.3% | $16M | |||
| Sausage | 0% | +63% | +42% | +35% | +24% | +17% | +21.3% | +14.4% | $120M | |||
| Frankfurters | -1% | +76% | +39% | +20% | +17% | +14% | +19.5% | +11.2% | $58M | |||
| Bacon | -6% | +54% | +48% | +34% | +18% | +19% | +22.2% | +16.4% | $115M | |||
Source: IRI, Total US, MULO, 1 week % change vs. YA
Grinds
After several very strong weeks with year-over-year dollar growth in the twenties, ground beef gains fell back to +10.9%. Ground turkey, that had seen great strength throughout the pandemic — particularly when ground beef prices were highly elevated — saw gains fall back into single digits. Additionally, volume dropped below 2019 levels for beef, and to single digit gains for turkey and chicken.
- Ground beef increased 10.9% in dollars and volume dipped below last year’s levels, at -0.8%
- Ground turkey, +8.0% in dollars and +2.7% in volume.
- Ground chicken, +14.0% in dollars and +8.7% in volume
- Ground pork, +18.0% in dollars and +14.7% in volume.
Combined, these four ground proteins generated $232 million in sales, down from $241 million the week prior. However, this was still an additional $22 million versus year ago. Ground beef represents 86.8% of sales but 88.1% of additional dollars.
Market Shifts
The pandemic market share trends remained unchanged in early August. Pork and beef had a higher dollar and volume share than pre-pandemic. Exotic meats, which includes bison, are the third protein with volume gains. Pork, in particular, has seen an uptick in volume share, from 16.5% during the first week of March to 18.2% the week ending August 2. Chicken and turkey remained down in both dollar and volume share.
| Share of dollar sales | Share of volume sales | |||||
| Week ending 3/1 | Week ending 8/2 | Building calendar year 2019 | Building calendar year 2020 |
Week ending 3/1 |
Week ending 8/2 |
|
| Beef | 53.3% | 57.0% | 54.2% | 55.5% | 37.0% | 38.5% |
| Chicken | 27.5% | 24.9% | 26.7% | 25.3% | 40.5% | 38.6% |
| Pork | 12.9% | 13.1% | 13.6% | 13.6% | 16.5% | 18.2% |
| Turkey | 4.4% | 3.8% | 4.2% | 4.3% | 4.8% | 4.1% |
| Lamb | 0.9% | 0.9% | 0.9% | 0.9% | 0.4% | 0.4% |
| Veal | 0.1% | 0.1% | 0.1% | 0.1% | 0.1% | 0.0% |
| Exotic | 0.3% | 0.3% | 0.3% | 0.3% | 0.2% | 0.3% |
Source: IRI, Total US, MULO, % of total meat department dollars | “All other” not reflected
What’s Next?
Consumer concern over COVID-19 is high but stable. Concerns over economic recovery, however, are still rising. Wave 16 of the IRI survey series shows that 65% of consumers expect the economic crisis to last at least 12 more months — the highest percentage across all survey waves and near double that of the 37% who expected the economy to need a year to recover back in March. The second week of August may also see continued sales impact from hurricane Isaias in areas up and down the eastern seaboard.
Back-to-school season is around the corner for several states, and half of parents with children ages six to twelve are now expecting their children to partake in virtual education (50%), with an additional 15% expecting mixed virtual and in-person education. Only 19% of parents expect their younger kids to go back face-to-face. Parents of teenagers expect 24% to go back in person, with 42% expecting virtual education only and 19% a mixed virtual and in-person system. This will once more completely change year-over-year trending, as many more meal occasions for these students will remain at-home.
Between the continued social distancing mandates, highly elevated consumer concern about the virus, economic pressure and the impact of virtual schooling, grocery sales are likely to remain highly elevated for the foreseeable future.
Looking for a reprint of this article?
From high-res PDFs to custom plaques, order your copy today!