Consumer Trends Report: The new normal
The ongoing pandemic continues to influence consumer behavior.

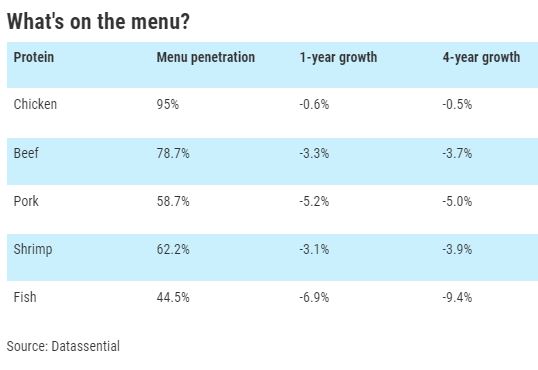
If you’re holding a restaurant menu, the odds are good that chicken will be on it. In our new normal of living through a historic pandemic, some things change and others don’t. And chicken has definitely proven its staying power. While consumers crave reliable, steady favorites, they are also interested in animal welfare, sustainable packaging and spicy, ethnic foods.
“Chicken is the most popular among these proteins on menus, appearing on 95% of all U.S. menus, followed by beef (78.%) and pork (58.%),” says Mike Kostyo, trendologist at Datassential, based in Chicago.
Chicken is also America’s favorite protein, with 87 percent of consumers loving or liking it, says Kostyo. “With that being said, consumers have told us that they are really looking forward to eating more seafood at restaurants post-COVID,” he says. “It’s a category that consumers feel less comfortable cooking at home, so they really trust a chef to make it for them.”
For now, chicken is still the top protein choice, with 78% of consumers eating chicken at least once a week, according to Technomic’s 2021 Poultry Consumer Trend Report. “Chicken is affordable relative to other proteins, but also craveable in formats like fried chicken and fried chicken sandwiches that have been so popular over the past few years,” says Anne Mills, director of consumer insights at Technomic, a Winsight Company, based in Chicago.
Traditional animal-based proteins are still in high demand among consumers. “Baby Boomers and matures are the two generations least likely to limit their meat and seafood consumption, while Millennials eat vegetarian or vegan dishes (without meat) most often,” says Mills.
Each generation has its own preferences for meal prep, too. “Thirty-five percent of Gen Z says they love or like sushi, for instance, while only 13 percent of Boomers say the same thing,” Kostyo says. “Younger consumers love fun, snackable options a lot more. Options like popcorn chicken and chicken nuggets score far higher with Gen Z, as do jerky options like beef and turkey jerky.”
Older generations are far more likely to prefer classic, premium cuts such as Virginia ham, London broil, New York strip steaks and shrimp scampi, which all skew toward older demographics, says Kostyo.
And consumers are willing to pay for what they want.
“The pandemic did not significantly change the value equation, but it did cause consumers to reshuffle what attributes they include as ‘good value,’” Mills says. “In 2020, those changes along with the economic downturn produced a recessionary mindset that impacted consumer willingness to pay. Today, however, we are seeing signs of cautious optimism.”
Consumers have increased what they are willing to pay across most restaurant categories and dayparts, according to Technomic’s 2021 Value and Pricing Consumer Trend Report.
Creating new favorites
While consumers may have explored new foods during pandemic ordering and shopping, they still miss old favorites. “Seafood menuing declined during the pandemic in part because so many consumers were ordering take-out or delivery, and seafood is not considered a food that travels as well as other choices,” Kostyo says.
REFRIGERATED LUNCH MEAT
| Product | Dollar Sales | Dollar Share of SubCategory | Unit Sales | Price per Unit | ||||
|
|
Current | %change VS VA | Current | %change VS VA | Current | %change VS VA | Current | %change VS VA |
| RFG SLICED LUNCHMEAT | $6,062,009,175 | 2.0% | 100.00 | 0.00 | 1,592,252,469 | -1.6% | $3.81 | $0.14 |
| PRIVATE LABEL-RFG SLICED LUNCHMEAT | $1,186,984,647 | 3.3% | 19.58 | 0.24 | 276,462,604 | -1.3% | $4.29 | $0.19 |
| HILLSHIRE FARM (Hillshire Brands Co.) | $812,381,678 | 12.7% | 13.40 | 1.26 | 188,557,334 | 13.0% | $4.31 | -$0.01 |
| OSCAR MAYER DELI FRESH (Kraft Heinz Co.) | $789,412,922 | 1.6% | 13.02 | -0.06 | 164,820,739 | 2.1% | $4.79 | -$0.02 |
| OSCAR MAYER (Kraft Heinz Co.) | $749,443,751 | -2.0% | 12.36 | -0.50 | 208,841,992 | -3.9% | $3.59 | $0.07 |
| LAND O FROST (Land O' Frost Inc.) | $297,998,175 | -7.3% | 4.92 | -0.49 | 72,825,293 | -7.8% | $4.09 | $0.02 |
| BOARS HEAD (Boars Head Provision Co.) | $158,908,939 | 10.7% | 2.62 | 0.21 | 25,846,706 | 9.8% | $6.15 | $0.05 |
| BAR S Bar-S Foods Co.) | $150,581,232 | -9.2% | 2.48 | -0.31 | 80,973,875 | -11.4% | $1.86 | $0.04 |
| OSCAR MAYER DELI FRESH BOLD (Kraft Heinz Co.) | $122,493,054 | 5.6% | 2.02 | 0.07 | 28,547,578 | 6.9% | $4.29 | -$0.05 |
| FIORUCCI (Campofrio Food Group) | $113,027,972 | 18.3% | 1.86 | 0.26 | 28,226,599 | 11.9% | $4.00 | $0.22 |
| HORMEL NATURAL CHOICE (Hormel Foods Corp.) | $109,162,026 | -21.1% | 1.80 | -0.53 | 26,761,269 | -24.4% | $4.08 | $0.17 |
Retail sales data attached for the categories/segments listed & top 10 brands per, latest 52 week period, Total US Multi-Outlet w/ C-Store (Grocery, Drug, Mass Market, Convenience, Military and Select Club & Dollar Retailers).
Operators can develop seafood-friendly options that travel well to meet a consumer need.
“Consumers also tell us that they miss some of the unique, globally inspired foods that they only get from restaurants,” says Kostyo. “From a foodservice perspective, menuing proteins in options like street tacos, empanadas, sushi, and Asian-inspired bowls will resonate with consumers.”
Some consumers have strayed away from beef because of its environmental impact and related health concerns, says Kostyo, but it’s still consumed by a wide variety of the population. “Although more consumers will likely restrict their beef consumption for those reasons, it’s still liked by 80% of consumers who’ve tried it, suggesting it has a great deal of staying power on menus,” he adds.
The issue that operators are facing right now, of course, are increasing food costs and ingredient shortages. “This summer over half, or 55%, of operators told us they have experienced chicken wing shortages in the past three months, while 39 percent said the same thing about chicken breasts and 34 percent said the same thing about beef,” Kostyo says.
Freezing out the competition
Last year, the meat department had an impressive year, and this year looks to be more of the same. “In fact, year-to-date, dollars aren’t too far off from those 2020 records, though pounds are tracking behind somewhat,” says Anne-Marie Roerink, principal and founder of 210 Analytics, in San Antonio, Texas.
Frozen protein is doing very well, too. “And each time we see shortages in fresh or high inflation in fresh, we see dollars move to frozen,” Roerink says. “It’s not just frozen meat that is doing well; it’s seafood, processed chicken and chicken that are all trending well ahead. In part, this is related to having inventory on hand, but also think about the popularity of the air fryer.”
Frozen entrees are also selling above year-ago and 2019 levels, due to their convenience, notes Roerink.
Consumers who stocked up on frozen meats and prepared meals last year were not spending as much time at the deli department. “Deli prepared did not have a great 2020, but sales have come roaring back,” says Roerink. “Deli prepared sales are now well ahead of 2020 and 2019.”
REFRIGERATED UNCOOKED MEATS (NO POULTRY)
| Product | Dollar Sales | Dollar Share of SubCategory | Unit Sales | Price per Unit | ||||
|
|
Current | %change VS VA | Current | %change VS VA | Current | %change VS VA | Current | %change VS VA |
| RFG UNCOOKED MEATS (NO POULTRY) | $6,594,481,323 | 1.3% | 100.00 | 0.00 | 927,531,028 | 0.1% | $7.11 | $0.08 |
| PRIVATE LABEL | $4,265,817,075 | 0.1% | 64.69 | -0.76 | 609,089,647 | -0.2% | $7.00 | $0.02 |
| NOBRAND INTERSTATE MEAT (Interstate Meat Dist. Inc.) | $673,923,256 | -2.9% | 10.22 | -0.44 | 79,276,521 | -6.3% | $8.50 | $0.30 |
| SMITHFIELD (Smithfield Foods) | $128,414,764 | 24.5% | 1.95 | 0.36 | 21,592,233 | 29.9% | $5.95 | -$0.25 |
| LAURAS LEAN BEEF (Laura's Lean Beef Co.) | $122,481,070 | 11.1% | 1.86 | 0.16 | 17,627,636 | 12.4% | $6.95 | -$0.08 |
| HORMEL ALWAYS TENDER (Hormel Foods Corp.) | $102,966,378 | 1.0% | 1.56 | 0.00 | 15,373,531 | 5.2% | $6.70 | -$0.28 |
| SCHWEID & SONS (Schweid & Sons) | $85,118,731 | 35.9% | 1.29 | 0.33 | 8,925,804 | 36.0% | $9.54 | -$0.01 |
| IBP (Tyson Fresh Meats Inc.) | $59,311,360 | -4.7% | 0.90 | -0.06 | 16,775,568 | -10.4% | $3.54 | $0.21 |
| HATFIELD (Clemens Food Group) | $47,661,727 | -0.9% | 0.72 | -0.02 | 7,113,198 | -1.2% | $6.70 | $0.02 |
| CARANDO CLASSIC ITALIAN (Farmland Foods Inc.) | $46,532,464 | 1.1% | 0.71 | 0.00 | 10,334,281 | 2.3% | $4.50 | -$0.05 |
| WAHLBURGERS (ARKK Food Co.) | $45,214,094 | 33.7% | 0.69 | 0.17 | 4,689,928 | 22.9% | $9.64 | $0.78 |
Retail sales data attached for the categories/segments listed & top 10 brands per, latest 52 week period, Total US Multi-Outlet w/ C-Store (Grocery, Drug, Mass Market, Convenience, Military and Select Club & Dollar Retailers).
Saving time and adding convenience
Savings – whether it’s for meal prep, shopping or cooking – is the most important product feature.
“We all started off very enthusiastically with scratch cooking at the onset of the pandemic, but that enthusiasm has been replaced by being bored with the same old, same old – as well as a renewed need for speed and ease as many commutes and evening activities are back on the schedule,” Roerink says. “I expect all time-saving solutions to do well, including heat-and-eat and ready-to-eat options.”
Meal kits were definitely popular for a while and peaked during the pandemic. “But they are not the best model going forward because they still require some planning,” says Melissa Abbott, vice president of Hartman Retainer Services, in Bellevue, Wash. “More retailers are offering consumers options for comparted meal preparations: pre-cut, pre-prep with strong flavors and less additives,” she says.
Rotisserie chicken isn’t going away. But there’s certainly room for new cuts of chicken, beef or pork in that type of format, Abbott says.
Value-added products also provide time savings for meal prep, says Roerink.
JERKY
| Product | Dollar Sales | Dollar Share of SubCategory | Unit Sales | Price per Unit | ||||
|
|
Current | %change VS VA | Current | %change VS VA | Current | %change VS VA | Current | %change VS VA |
| JERKY | $2,047,877,833 | 19.5% | 100.00 | 0.00 | 316,069,548 | 14.0% | $6.48 | $0.30 |
| JACK LINKS-JERKY | $953,859,430 | 21.0% | 46.58 | 0.58 | 151,736,152 | 17.7% | $6.29 | $0.17 |
| OLD TRAPPER-JERKY | $264,286,739 | 23.8% | 12.91 | 0.45 | 22,050,654 | 16.2% | $11.99 | $0.74 |
| PRIVATE LABEL-JERKY | $215,863,543 | 26.3% | 10.54 | 0.57 | 43,798,296 | 18.4% | $4.93 | $0.31 |
| BRIDGFORD SWEET BABY RAYS-JERKY | $131,985,704 | 23.1% | 6.44 | 0.19 | 26,608,724 | 20.4% | $4.96 | $0.11 |
| TILLAMOOK COUNTRY SMOKER-JERKY | $62,032,599 | 26.5% | 3.03 | 0.17 | 10,463,862 | 19.4% | $5.93 | $0.33 |
| CATTLEMANS CUT-JERKY | $49,056,399 | 29.4% | 2.40 | 0.18 | 5,484,171 | 26.0% | $8.95 | $0.24 |
| NO MANS LAND-JERKY | $44,982,812 | 68.7% | 2.20 | 0.64 | 4,340,858 | 57.1% | $10.36 | $0.71 |
| OBERTO-JERKY | $24,553,093 | -16.8% | 1.20 | -0.52 | 4,311,914 | -20.8% | $5.69 | $0.27 |
| COUNTRY ARCHER-JERKY | $23,893,307 | 17.8% | 1.17 | -0.02 | 3,716,329 | 15.9% | $6.43 | $0.10 |
| MINGUA BEEF JERKY-JERKY | $19,828,172 | 30.0% | 0.97 | 0.08 | 2,617,207 | 27.2% | $7.58 | $0.16 |
Retail sales data attached for the categories/segments listed & top 10 brands per, latest 52 week period, Total US Multi-Outlet w/ C-Store (Grocery, Drug, Mass Market, Convenience, Military and Select Club & Dollar Retailers).
ALL OTHER DRIED MEAT SNACKS
| Product | Dollar Sales | Dollar Share of SubCategory | Unit Sales | Price per Unit | ||||
|
|
Current | %change VS VA | Current | %change VS VA | Current | %change VS VA | Current | %change VS VA |
| ALL OTHER DRIED MEAT SNACKS | $2,121,882,593 | 16.8% | 100.00 | 0.00 | 803,554,349 | 5.9% | $2.64 | $0.25 |
| SLIM JIM-ALL OTHER DRIED MEAT SNACKS | $678,535,596 | 4.7% | 31.98 | -3.69 | 292,519,168 | -7.6% | $2.32 | $0.27 |
| JACK LINKS-ALL OTHER DRIED MEAT SNACKS | $573,147,203 | 24.7% | 27.01 | 1.71 | 199,563,087 | 16.6% | $2.87 | $0.18 |
| OLD WISCONSIN-ALL OTHER DRIED MEAT SNACKS | $133,918,008 | 28.0% | 6.31 | 0.55 | 23,191,081 | 22.0% | $5.77 | $0.27 |
| JACK LINKS WILD-ALL OTHER DRIED MEAT SNACKS | $81,596,303 | 20.3% | 3.85 | 0.11 | 35,445,183 | 16.1% | $2.30 | $0.08 |
| PRIVATE LABEL-ALL OTHER DRIED MEAT SNACKS | $63,863,008 | 23.9% | 3.01 | 0.17 | 18,942,181 | 13.0% | $3.37 | $0.30 |
| DUKES-ALL OTHER DRIED MEAT SNACKS | $58,409,939 | 7.2% | 2.75 | -0.25 | 9,432,964 | -4.5% | $6.19 | $0.68 |
| MATADOR BY JACK LINKS-ALL OTHER DRIED MEAT SNACKS | $44,470,087 | 1.0% | 2.10 | -0.33 | 27,661,840 | 9.7% | $1.61 | -$0.14 |
| TILLAMOOK COUNTRY SMOKER-ALL OTHER DRIED MEAT SNACKS | $43,988,693 | 28.3% | 2.07 | 0.19 | 18,576,973 | -1.8% | $2.37 | $0.55 |
| OLD TRAPPER-ALL OTHER DRIED MEAT SNACKS | $43,052,369 | 68.4% | 2.03 | 0.62 | 8,476,075 | 40.8% | $5.08 | $0.83 |
| PENROSE BIG MAMA-ALL OTHER DRIED MEAT SNACKS | $36,513,074 | 11.5% | 1.72 | -0.08 | 19,362,873 | 8.7% | $1.89 | $0.05 |
Retail sales data attached for the categories/segments listed & top 10 brands per, latest 52 week period, Total US Multi-Outlet w/ C-Store (Grocery, Drug, Mass Market, Convenience, Military and Select Club & Dollar Retailers).
Creating new relationships
For many years, consumers have been interested in animal welfare and no hormones or antibiotics in their meat.
“Before the pandemic, there was increased interest in animal welfare, and it has risen quite a bit within the pandemic,” Abbott says. “They were worried about their health and had more time to research their food, especially when shopping online.”
Shoppers also showed more interest in buying local. “Consumers don’t want to rely on national producers and they like having a relationship with a local company,” says Abbott. “It gives them a good feeling, besides liking the taste of the product.” In the long run, it remains to be seen if this preference will continue.
It is clear that many Americans still enjoy eating animal protein, but some feel guilty because of concerns about animal welfare and meat production’s effect on the environment.
“They have many questions, and it’s important for the industry to answer those,” says Roerink. “With the power of podcasts, documentaries and social media, I think all these platforms are going to be of rising importance, especially among younger consumers.”
FROZEN/REFRIGERATED CHICKEN/CHICKEN SUBSTITUTE
| Product | Dollar Sales | Dollar Share of SubCategory | Unit Sales | Price per Unit | ||||
|
|
Current | %change VS VA | Current | %change VS VA | Current | %change VS VA | Current | %change VS VA |
| FZ/RFG CHICKEN/CHICKEN SUBSTITUTE | $2,838,590,331 | -3.1% | 100.00 | 0.00 | 396,957,157 | -6.1% | $7.15 | $0.22 |
| PRIVATE LABEL-FZ/RFG CHICKEN/CHICKEN SUBSTITUTE | $1,102,259,468 | -5.2% | 38.83 | -0.83 | 129,766,278 | -9.3% | $8.49 | $0.37 |
| TYSON (Tyson Foods Inc.) | $299,224,981 | -10.8% | 10.54 | -0.90 | 39,659,166 | -4.1% | $7.54 | -$0.56 |
| JUST BARE (Gold N Plump/GNP Co.) | $154,033,390 | 33.7% | 5.43 | 1.49 | 22,085,124 | 35.0% | $6.97 | -$0.07 |
| PERDUE (Perdue Farms Inc.) | $129,484,361 | -16.7% | 4.56 | -0.74 | 24,883,187 | -16.8% | $5.20 | $0.00 |
| BARBER FOODS (Advancepierre Foods Inc.) | $123,281,036 | 17.7% | 4.34 | 0.77 | 16,821,618 | 10.9% | $7.33 | $0.42 |
| PERDUE PERFECT PORTIONS (Perdue Farms Inc.) | $91,960,354 | -2.4% | 3.24 | 0.03 | 10,488,818 | -7.5% | $8.77 | $0.46 |
| PERDUE HARVESTLAND (Perdue Farms Inc.) | $79,752,899 | -12.8% | 2.81 | -0.31 | 12,272,971 | -13.4% | $6.50 | $0.05 |
| PILGRIMS (Pilgrims Pride Inc.) | $61,863,808 | 12.7% | 2.18 | 0.31 | 6,072,093 | 12.9% | $10.19 | -$0.02 |
| GOLD LEAF (Gold Leaf of Nebraska) | $41,313,223 | -24.7% | 1.46 | -0.42 | 7,814,607 | -18.6% | $5.29 | -$0.43 |
Retail sales data attached for the categories/segments listed & top 10 brands per, latest 52 week period, Total US Multi-Outlet w/ C-Store (Grocery, Drug, Mass Market, Convenience, Military and Select Club & Dollar Retailers).
Reducing packaging waste
Consumers’ awareness of packaging waste has increased during their time at home. But it has shifted from recycling to scrutiny over excess packaging, Abbott says.
“Excess packaging is the real death knell for companies now,” she says. Consumers prefer innovative, sustainable packaging, and are paying attention.
In addition, packaging needs have evolved as people spend more time online shopping, buying in bulk and freezing meat. “To curb shrink at retail but also to provide more flexibility at home, vacuum packs, such as rollstock or skin packs, are making rapid inroads,” Roerink says.
Consumers are interested in a wider variety of package sizes, too, “in part because of varying household sizes and in part because of the high inflation,” says Roerink.
The ongoing pandemic continues to influence consumer behavior. “For now, COVID has a firm grip on how, when and where the food dollar is being spent,” says Roerink.
The more things change, the more they stay the same. “So more than 20 months later, the patterns are still in flux,” Roerink says. “We were starting to trend back to normal in things like trips, basket size, household penetration in various categories, but recent months prompted an about face in many of those pandemic-related trends.”
Looking for a reprint of this article?
From high-res PDFs to custom plaques, order your copy today!


