State of the Industry 2018
State of the Chicken Industry 2018
A lion's share of resolve, optimism
Continuing to overcome a number of difficult challenges during the past few years has resulted in positive production increases for the chicken industry. At the same time, this experience has also strengthened essentially all companies’ resolve and sense of optimism about their businesses as they look toward the start of a new decade just over the horizon. Companies have responded to consumer demand for more specialty chicken products, value-added items, enhanced animal welfare standards, better communication about sustainability efforts and greater transparency of production and processing methods. This is in addition to companies devoting more and more assets to continue to improve food safety and the safety of our workforce.
Other measures of this optimism to invest in the future are the plans by multiple broiler companies to bring on six new complexes by 2020 or 2021. Additionally, there are plans by another half-dozen or more to add at least one more inspection line to existing slaughter facilities. Combined, this additional capacity will result in 550 million more chickens (a greater than 8 percent increase) being processed on an annual basis.
Consumption
One record that has continued to be broken annually since 2013 is chicken consumption. Per capita chicken (broilers plus spent hens) consumption in 2019 is slated by USDA to be 94.5 pounds, another record high.
Combined poultry and red meat consumption could reach 224 pounds per person in 2019 compared with 220+ pounds in 2018. For consumers to be motivated to eat about 4 pounds more of poultry/red meat in 2019 will require a continued good U.S. general economy, low unemployment and retail poultry/meat prices favorable to consumers. Consumption in 2019 will be a record and measurably higher than the previous record of 222 pounds in 2004.
ANNUAL BROILER FORECASTS
| 2015 | 2016 | 2017 | 2018 | 2019 | |
|---|---|---|---|---|---|
| Production (million lb.) | 40,048 | 40,696 | 41,662 | 42,615 | 43,420 |
| Per capita disappearance (retail lb.)* | 89.0 | 89.7 | 90.8 | 92.7 | 93.7 |
| Broiler exports (million lb.) | 6,321 | 6,645 | 6,791 | 6,869 | 7,045 |
Forecasts are in bold. * Per capita meat disappearance data are calculated using the Resident Population Plus Armed Forces Overseas series from the Census Bureau of the Department of Commerce. All data as of Aug. 14, 2018. Source: World Agricultural Supply and Demand Estimates and Supporting Materials. For further information, contact: Mildred M. Haley, mhaley@ers.usda.gov
Transparency
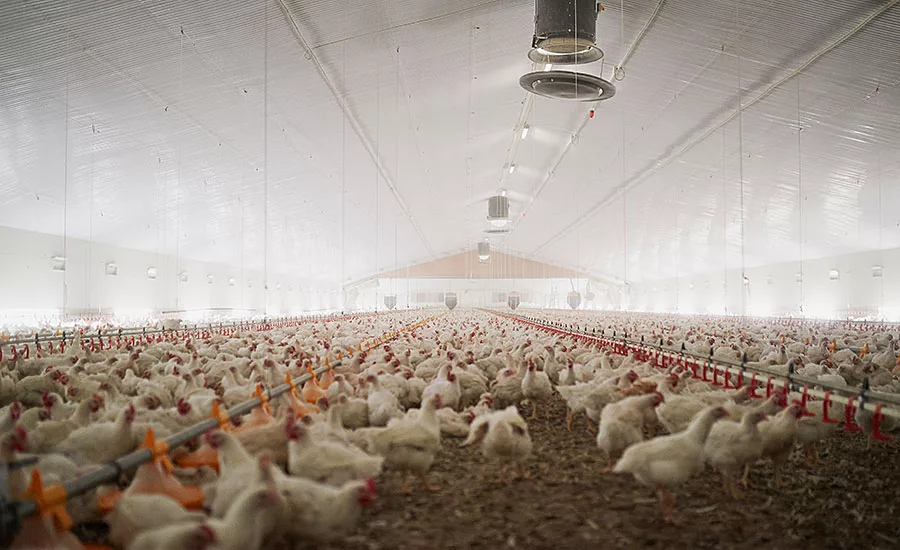
As per capita chicken consumption breaks a new record in 2018 and consumers express a growing interest about where their food comes from, the National Chicken Council recently developed a series of 360-degree virtual reality videos showing the various stages of chicken’s life during modern, commercial production. The new experience is part of NCC’s Chicken Check In program, which serves as a resource for consumers to get the information they seek about how most meat chickens are raised and processed.
The virtual reality experience is launched on the heels of a national survey revealing that nearly 90 percent of consumers are interested in deeper information about the chicken they buy and eat. Additionally, nearly 40 percent of consumers indicate information about “how chickens are cared for” as one of the top topics they care about most.
We know people want more information about chicken production and that most have not visited a chicken farm, so we are bringing the farm to them. Through our virtual reality tours, viewers are able to see the way most chickens are hatched, raised and processed in the U.S. — it’s a fully immersive experience.
FROZEN/ REFRIG. CHICKEN/ CHICKEN SUBSTITUTE: TOP 10 RETAIL BRANDS
| Brand | Dollar Sales | Dollar Sales % Chg YAgo | Unit Sales | Unit Sales % Chg YAgo |
|---|---|---|---|---|
| Private Label | $1,071,180,800 | 3.30 | 152,026,640 | 0.46 |
| Tyson | $448,791,040 | (10.65) | 49,300,128 | (14.33) |
| Perdue | $100,284,336 | 14.79 | 22,607,578 | 8.41 |
| TGI Friday's | $92,910,448 | 6.40 | 20,035,420 | 7.78 |
| Perdue Perfect Portions | $80,814,624 | (6.85) | 10,154,031 | (10.97) |
| Barber Foods | $79,918,648 | (0.95) | 12,296,482 | (2.47) |
| Gold'n Plump | $78,390,552 | (27.10) | 12,687,637 | (28.29) |
| Just Bare | $69,274,344 | (13.45) | 10,011,568 | (14.27) |
| Gardein | $51,209,612 | 47.24 | 12,245,955 | 46.60 |
| Harvestland | $50,897,824 | (19.96) | 7,892,616 | (18.50) |
| Total Frozen/ Refrig. Chicken/ Chicken Substitute | $2,785,068,032 | (3.15) | 428,905,984 | (3.22) |
| Total Frozen/ Refrig. Poultry | $4,296,069,632 | (1.46) | 734,378,944 | (0.73) |
Source: Infoscan Reviews, IRI, a Chicago-based market research firm (@iriworldwide). Total US Multi-Outlet (Grocery, Drug, Mass Market, Military and Select Club & Dollar Retailers), latest 52 weeks ending Aug. 12, 2018.
Note: Rankings of top brands are NOT totaled brand listings (e.g. all UPCs or brand extensions rolled up into a single figure, such as Total Crest Toothpaste), but are rather individual brand listings.
Production
USDA’s forecast for chicken production is to increase 2.5 percent in 2019 over 2018, which compares with 2.1 percent estimated for 2018. If, in fact, chicken marketings rise 2.5 percent in 2019, it will be the largest annual increase since 2015 when output rose 3.9 percent, which is the long-run annual average increase from 1970 to 2015.
To compensate for some loss in the rate of eggs laid by breeder hens and lower hatchability over the past year and a half or more, producers have returned to raising relatively more heavyweight birds. When the first half of 2017 saw the average bird weight plateau, some industry observers speculated the trend toward more big birds had finally come to an end.
So far in 2018, according to USDA’s Agricultural Marketing Service (AMS), the largest size category of broilers is averaging more than 9 pounds, an increase of 3.5 from last year, and representing about 30 percent of total liveweight pounds produced.
Much of the leg quarters from these birds are exported but a good and apparently increasing share of the meat from these cuts remains on the domestic U.S. market in the form of deboned thigh meat. Helping to spur this development is that the wholesale price for deboned/skinless thigh meat is comparing more favorable with the price of boneless/skinless breast meat, as reported monthly by USDA’s AMS.
With abundant availability of beef and especially pork, retailers have feature priced many of the red meat cuts to drive customer counts and expand the total register ring for the meat department. Also, the improved general economy and accompanying rise in disposable household income have offered food shoppers the opportunity to take advantage of these features. Although not extinct, in 2018 it is much more difficult to find 10-pound bags of leg quarters offered at deeply discounted retail prices. This shift has resulted in more leg quarters available for the export market and for further processing.
PROCESSED FRZ./REFRIG. CHICKEN/CHICKEN SUBSTITUTE: TOP 10 RETAIL BRANDS
| Brand | Dollar Sales | Dollar Sales % Chg YAgo | Unit Sales | Unit Sales % Chg YAgo |
|---|---|---|---|---|
| Tyson | $861,176,192 | 1.87 | 123,824,768 | 2.43 |
| Private Label | $424,958,048 | 12.12 | 75,427,224 | 11.92 |
| Tyson Any'tizers | $288,893,376 | (0.67) | 40,750,852 | (1.67) |
| Perdue | $186,551,344 | 0.22 | 40,727,352 | 3.30 |
| Tyson Grilled and Ready | $181,507,680 | (21.03) | 24,234,270 | (34.47) |
| Foster Farms | $130,815,976 | 1.71 | 21,056,516 | 0.56 |
| John Soules Foods | $110,817,760 | 5.31 | 26,698,924 | 8.18 |
| Banquet | $97,601,680 | (4.64) | 20,512,836 | (5.17) |
| Perdue Short Cuts | $91,831,008 | 10.33 | 24,461,154 | 12.10 |
| Innovasion Cuisine | $44,288,284 | 1.72 | 8,157,978 | 2.35 |
| Total Processed Frz./ Refrig. Chicken/ Chicken Substitute | $2,936,376,320 | 0.85 | 494,042,112 | 0.29 |
| Total Processed Frozen/ Refrig. Poultry | $2,995,914,496 | 1.00 | 504,548,544 | 0.26 |
Source: Infoscan Reviews, IRI, a Chicago-based market research firm (@iriworldwide). Total US Multi-Outlet (Grocery, Drug, Mass Market, Military and Select Club & Dollar Retailers), latest 52 weeks ending Aug. 12, 2018.
Note: Rankings of top brands are NOT totaled brand listings (e.g. all UPCs or brand extensions rolled up into a single figure, such as Total Crest Toothpaste), but are rather individual brand listings.
Exports
More than 7 billion pounds of chicken, mostly leg quarters, are expected by USDA to be exported in 2019, a better than 2.5 percent increase over 2018. This exported quantity would account for 16.4 percent of total chicken marketings. Although chicken exports have made steady, albeit modest, annual gains during the past few years, it is unlikely the record level of exports of 7.345 billion pounds in 2013 will be surpassed in 2019 or, perhaps even in 2020.

It is a bit puzzling that U.S. exports haven’t expanded more rapidly in 2018. Brazil, the leading global poultry exporter, experienced both chicken production and export problems during late 2017 and especially first half 2018. Higher feed costs exacerbated by trucking transportation problems caused monthlong disruptions for a number of major chicken companies. At the same time, certain foreign countries significantly cut back or even prohibited Brazilian chicken on their markets as questions about the Brazilian inspection program and food safety were raised. Reportedly, Brazilian chicken production and exports are beginning to regain more normal levels. Nonetheless, reports suggest both Brazilian chicken production and exports could decline as much as 3 percent in 2018, a scenario not experienced in decades.
Conclusion
An abundance of both challenges and opportunities will continue to be the operating environment for the chicken industry in 2019. Adroitly meeting the challenges while recognizing and seizing the best opportunities will be the first priority for federally inspected chicken companies. NP
Survey methodology
The survey was commissioned by the National Chicken Council and conducted online by ORC International June 4-7 among 1,004 adults. Funding was provided by Elanco, Truow Nutrition, WATT Global Media and IRI.
Looking for a reprint of this article?
From high-res PDFs to custom plaques, order your copy today!


