State of the Industry 2018
State of the Seafood Industry 2018
The age of seafood arrives
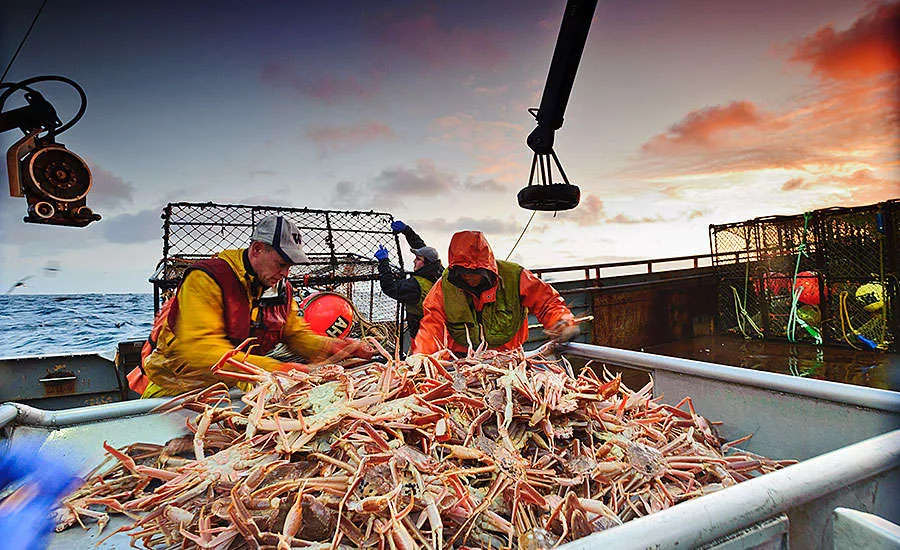
Photos courtesy of the Alaska Seafood Marketing Institute (ASMI)
Photos courtesy of the Alaska Seafood Marketing Institute (ASMI)
This is the age of seafood. Foodable Labs, in its 2018 Protein Sourcing Report, noted an 81.3 percent increase in positive social-media mentions of seafood year-over-year. The 2018 Edelman Trust Barometer shows the public trusting fishermen, alongside much-loved farmers, as food producers. Finally, fish as a functional food is bubbling up as a unique source of DHA and EPA, long-chain omega-3s, the silver bullet for human disease and suffering.
The U.S. Dietary Guidelines recommend Americans eat 8 ounces of seafood per week, to help reduce their risk of heart disease, certain types of cancer and obesity. Just two years ago, the estimated U.S. per capita consumption of fish and shellfish was only 14.9 pounds ($93.2 billion) (NOAA) instead of the recommended 26. With 44 percent of consumers experimenting with various eating plans, many of which favor seafood as a complete source of protein, consumption is projected to increase. 2018 Nielsen reports: “Taste and health are still primary drivers of seafood purchase behavior.”
Clearly seafood is trending, so why aren’t hungry Americans eating more of it? One reason: Consumers are less familiar with seafood than other proteins according to Technomic’s Center of the Plate: Seafood & Vegetarian Consumer Trend Report 2017. Compared with beef or pork, the seafood category covers thousands of species with thousands of origins. There are multiple certification programs and watch lists to intimidate the newcomer and the professional. Finally, the quickest of the animal proteins to prep and cook seems to stump most people.
These barriers, however, are wearing away. The seafood industry is beginning to recognize the benefits of a united voice that avoids intramural challenges in favor of simple messaging: Eat more seafood.
Meal kits have been a huge boon to the seafood industry, putting a variety of species into home kitchens without the need for decision-making, and with simple step-by-step instructions. According to Nielsen, meal kits are a rapidly growing grocery option, with $154.6 million of in-store meal kits sold last year. New cooking technologies such as Instant Pot, sous vide and smart kitchen appliances are helping to build consumer confidence in their abilities to prepare delicious seafood meals at home. In-store demos featuring chefs have also proven to be a great way to introduce the seafood-curious to easy and flavorful ways to cook seafood.
REFRIGERATED FISH/ HERRING/ SEAFOOD: TOP 10 RETAIL BRANDS
| Brand | Dollar Sales | Dollar Sales % Chg YAgo | Unit Sales | Unit Sales % Chg YAgo |
|---|---|---|---|---|
| Private Label | $117,000,072 | 7.06 | 21,030,308 | 1.98 |
| Trans Ocean | $62,274,952 | 10.04 | 23,875,994 | 10.80 |
| Acme | $27,316,448 | 8.63 | 3,111,397 | 6.10 |
| Echo Falls | $24,438,378 | 5.87 | 2,980,192 | 1.37 |
| Vita | $23,698,898 | (6.22) | 3,964,432 | (8.66) |
| Paramount Reserve | $20,995,108 | (8.62) | 1,220,364 | (17.76) |
| Chicken of the Sea | $20,886,400 | (0.94) | 1,168,282 | (22.22) |
| Dockside Classics | $19,807,830 | 3.44 | 3,125,915 | 4.33 |
| Louis Kemp Crab Delight | $17,726,378 | (11.85) | 6,056,907 | (12.97) |
| Ducktrap River | $16,378,396 | 14.43 | 1,942,607 | 13.19 |
| Total Category | $650,433,664 | 5.58 | 113,887,872 | 2.98 |
Source: Infoscan Reviews, IRI, a Chicago-based market research firm (@iriworldwide). Total US Multi-Outlet (Grocery, Drug, Mass Market, Military and Select Club & Dollar Retailers), latest 52 weeks ending Aug. 12, 2018.
Note: Rankings of top brands are NOT totaled brand listings (e.g. all UPCs or brand extensions rolled up into a single figure, such as Total Crest Toothpaste), but are rather individual brand listings.
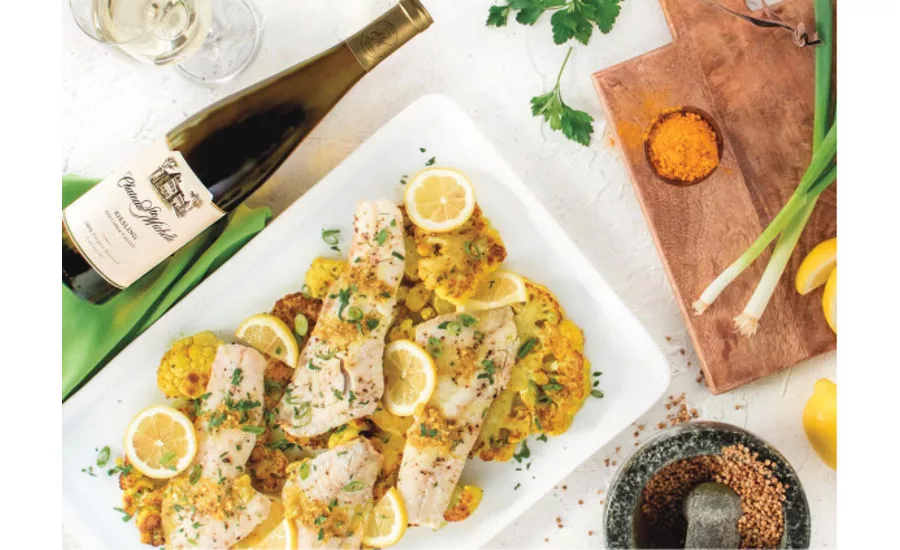
Cross-merchandising partnerships can give fish and shellfish a “hall pass” out of their potentially intimidating departments into the safe and easy zones of the store. Familiar items — such as those of Alaska Seafood Marketing Institute (ASMI)’s co-op partners Ste. Michelle Wine Estates and Kona Brewing Co. — can help people understand eating seafood can be as easy and everyday as a beer or wine after work.
Price is a barrier, too. Again, according to Technomic, as the price of other proteins falls, seafood looks more expensive. Wild Alaska pollock products are jumping this hurdle with the affordable product forms that are soaring in sales.
Undercurrent News quotes Torunn Halhjem, senior executive at Trident Seafoods: “I have been with Trident for 18 years and have never seen such a rapid increase in demand.”
In her presentation at North Atlantic Seafood Forum (NASF), she showed that U.S. demand was projected to rise 15,000 metric tons in 2018. With quality guardrails, white fish in the everyday price range of chicken could be the gateway to Americans eating more seafood.
More and more eaters who’ve been outside the category for taste and texture are dipping their toes in, according to ASMI’s proprietary research. The research shows that a long history with the category is not required to convert them. This is partially because of the diversification of America and its accompanying variety of flavor profiles. Many of the current non-eaters are congregated in urban areas where more food options are available and affordable. They are expanding their social networks and their palates at the same time.
FROZEN SEAFOOD CATEGORY
| Subcategory | Dollar Sales | Dollar Sales % Chg YAgo | Unit Sales | Unit Sales % Chg YAgo |
|---|---|---|---|---|
| Frozen Fish/ Seafood | $2,221,290,752 | 1.60 | 292,052,288 | (1.65) |
| Frozen Shrimp | $2,531,868,672 | 7.29 | 280,304,992 | 4.90 |
| Total Frozen Seafood | $4,753,159,680 | 4.55 | 572,357,312 | 1.45 |
Source: Infoscan Reviews, IRI, a Chicago-based market research firm (@iriworldwide). Total US Multi-Outlet (Grocery, Drug, Mass Market, Military and Select Club & Dollar Retailers), latest 52 weeks ending Aug. 12, 2018.
Note: Rankings of top brands are NOT totaled brand listings (e.g. all UPCs or brand extensions rolled up into a single figure, such as Total Crest Toothpaste), but are rather individual brand listings.
In 2017, ASMI partnered with Technomic to research the current and future seafood eater in the U.S. The 4,000-respondent study gave the institute what it was looking for: a psychographic segmentation picture of America.
The data breaks down into five segments:
- Pragmatist: chooses food that is the easiest and affordable;
- Conscious Consumer: sources food that aligns with her worldview;
- Traditionalist: sticks with what he or she knows;
- Originator: always on trend, always socializing;
- Optimizer: uses technology to facilitate his busy lifestyle.
Of these five, the final two — the Originator and the Optimizer — are the most valuable, representing 55 percent of the seafood spend. Below is a basic description of the two halves of the seafood super-consumer.
The Originator skews female.
- She boosts brands she aligns with on her social channels and in person.
- Food is a form of entertainment at home and away from home.
- Her income level is the highest of the group regardless of where she lives.
- She attributes some of her improved health to an increase of seafood consumption in just the past two years.
- She cares about the planet and American jobs.
- She will pay more for brands that are sustainable and for premium quality.
To keep her engaged in the category, it’s important to remain transparent and keep the confusion in the marketplace to a minimum. Health without sacrificing flavor, and at a low carbon footprint cost, plus American jobs are key messaging points for these brand ambassadors.
ASMI has partnered with the popular shopping app Ibotta. The most recent campaign delivered valuable “basket adjacent” data that validates the consumer research. Based on the transaction data, shoppers who purchased Alaska seafood were 59.2 times more likely to purchase leafy greens. Additionally, basket rings were 52 times more likely to include pasta and 48.7 times more likely to include sauce. These inclusions point to meal planning, a behavioral footprint of the Originator, who the research identifies as a purposeful shopper.
The Optimizer skews male.
- He is busy, and food is fuel. He needs convenient food solutions that are repeatable.
- He is active on social and digital channels to meet his needs as well as for entertainment.
- He is less likely to try something new, but he is influenced by Originators.
- He has a higher household income.
- He is interested in issues such as climate change and American jobs.
- He is price sensitive but is willing to pay more for brands he trusts.
- Thirty-three percent became seafood eaters within the last one to 10 years.

To keep him engaged in the category, seafood options need to be ubiquitous, simple, digital and high quality. Steps should be taken to prevent even one bad experience, as his busy schedule results in binary decision-making. Trust levers are similar to the Originator, including transparency and responsible fisheries management that stands up to scrutiny. Seafood earns his loyalty when he feels better physically eating more seafood, supporting American jobs and reducing his carbon footprint.
Seafood sustainability is paramount to both groups. In the seafood industry, the fishermen and the family unit fishing, the scientists, the experts and the many other stakeholders’ dedication to transparency and protecting the resource, are key to the long-term sustainability of the world’s fish and shellfish. According to the United Nations’ Food and Agriculture Organization (FAO), 69 percent of the world’s fisheries are sustainable, contributing 82 percent of consumed seafood. In Alaska, 100 percent of the fisheries are sustainable.
This is an exciting time for seafood. Across the supply chain, from harvesters and processors to chefs and retailers, we can make it easier for consumers to navigate the choppy waters by simply encouraging people to eat more seafood. NP
Looking for a reprint of this article?
From high-res PDFs to custom plaques, order your copy today!


