Channel shifts affect October meat dollar distribution
A big contributor to more meals being prepared in the home is the lunch occasion, as nearly half the workforce works from home one or more days a week.
The share of meals prepared at home remained elevated in October, at a consumer estimated 78.4% of all occasions, according to the IRI survey of primary grocery shoppers. A big contributor to more meals being prepared in the home is the lunch occasion. While down from the 2020 peaks, 47% of the active workforce, or 26% of the total population, work from home one or more days a week.
- When working from home, these consumers have a range of lunch go to’s. However, restaurants rarely make it into the working-from-home lunch lineup.
- Describing their working-from-home lunches in the past two weeks, IRI survey respondents heavily relied on eating leftovers (59%), making sandwiches (41%) or grabbing a quick snack, such as yogurt or snack nuts (39%). One-third prepared a quick meal and 24% eat a pre-packaged meal, such as a frozen entrée or can of soup. An equal 24% of shoppers made salads at home. To the contrary, just 16% of consumers got restaurant takeout or delivery for lunch and an even lower 8% left the house to have lunch at a restaurant. These lunch trends may be an opportunity for the meat department to position larger cuts, such as roasts, as tonight’s dinner and tomorrow’s lunch for a cost-effective and time-efficient two-for-one meal solution. The trend is a big opportunity for fully-cooked meats that can be added to a salad and lunchmeats as well.
- Parents with children between the ages of 6 and 17 are also slightly more likely to pack school lunches for their children this year. One-quarter (23%) pack food to bring to school more often than they did last year, whereas 15% buy/receive school lunch more often — for a net gain of 8 percentage points versus year ago.
In addition to a greater share of lunches having moved to the home, overall restaurant engagement was also down from 82% in earlier IRI surveys. In October, 79% of consumers purchased restaurant food, whether eaten on premise or ordered for takeout or delivery. Restaurant takeout, and especially delivery, continued to skew toward younger consumers. Thinking through their plans for the upcoming month, 24% expect they will eat at restaurants less often versus only 4% who believe they will increase their restaurant trips.
Inflation is the major undercurrent for many of the changes in grocery shopping and consumption patterns.
- The IRI October survey found that 95% of shoppers feel that they are paying more for groceries than last year, with eggs topping the list of examples. As a result of the higher prices, 80% of consumers shopped for groceries differently, including where and what they purchase. The most popular money-saving measures are looking for sales/deals more often (55%), cutting back on non-essentials (45%), looking for coupons (35%) and buying store-brand items (31%). What constitutes a non-essential item highly depends on the household.
- 15% included lower-cost retailers and 18% visit multiple stores to get the best deals. This has prompted more trips across food and beverage categories, despite the higher gasoline prices. IRI’s Integrated Fresh Household Panel found that store trips were up 2.0% in October 2022 versus year ago.
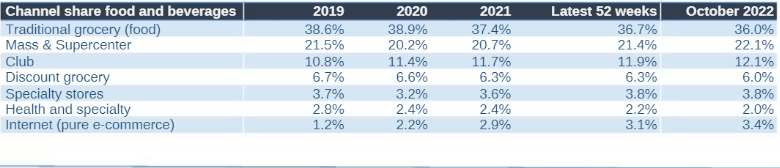
Channel shifting has had a substantial impact on the dollar share distribution, according to IRI’s Integrated Fresh Household Panel, which tracks shopper behavior for fixed and random weight products across all the stores in which consumers shop for retail food and beverages.
- In October, the traditional grocery share dropped to 36.0% of all food and beverage dollars — its lowest share of the pandemic period and well below the 38.6% share in 2019.
- Health/specialty grocery stores (see below for definitions) also dropped to their lowest level, at 2.0%.
- The main beneficiaries of channel share shifting Mass/Supercenter that rose to 22.1% of total sales.
- The Club channel has also gained 1.3 points in food/beverage share since 2019, reaching a high of 12.1%.
- Further, online food/beverage sales have close to tripled, now holding 3.4% share of the omnichannel view.
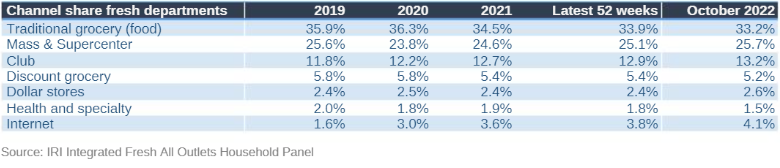
When regarding fresh departments only, the shifts follow the same patterns: a new low share for traditional grocery and elevated shares for mass/supercenter, club, dollar and online channels.
Prolonged supply chain, labor, transportation, global market and weather challenges in combination with a sharpening consumer reactions to the high food inflation is resulting in an ever-changing nature of the marketplace. IRI, 210 Analytics and Marriner Marketing continue to team up to bring the latest trends and analysis relative to meat department sales, including fresh and processed items.
Inflation insights
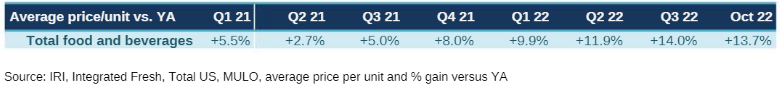
The price per unit across all foods and beverages in the IRI-measured multi-outlet stores, including supermarkets, club, mass, supercenter, drug and military, increased 13.7% in October 2022 (the five weeks ending 10/30/2022) versus the same month in 2021. October inflation was +17.0% in the center of the store (grocery) and +11.2% for perishables. Compared with October 2019, prices across all foods and beverages were up 28.8% — prompting a significant reduction of purchasing power for most Americans.
The average price per pound in the meat department across all cuts and kinds, both fixed and random weight, stood at $4.53 in October 2022 — continuing a trend of deceleration price increases. This is also illustrated by the month-over-month inflation being up 5.3% versus the latest 52-week view showing a 10.3% increase. This means meat had below-average inflation compared to total foods and beverages, especially on the fresh meat side. Inflation in processed meat also dropped into single-digits for the first time in many months.
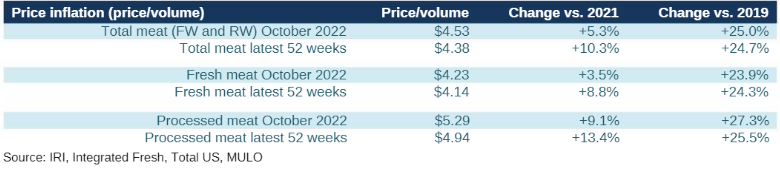
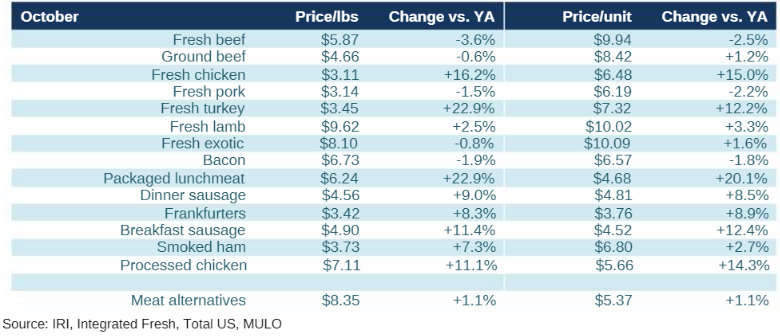
The moderation in price increases is driven by beef, pork, exotic (including bison) and bacon. On the other hand, both chicken and turkey continued to experience double-digit inflation, though the increases are moderating here as well. Tukey and packaged lunchmeat had the highest increases of all, at +22.9% over October 2021 levels.
Meat sales October 2022
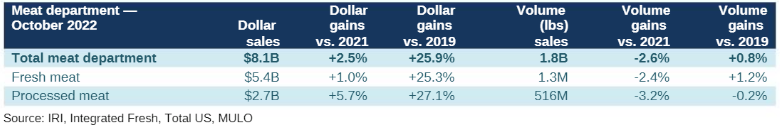
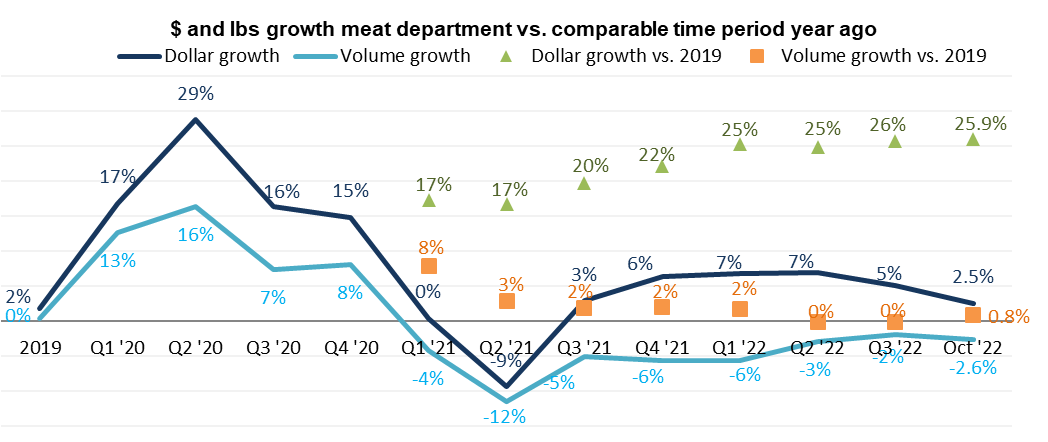
With inflation moderating, the year-on-year growth numbers are coming down a bit. October dollars exceeded prior year levels by 2.5% and volume sales were within 2.6% of last year. Additionally, October volume moved significantly ahead of the 2019 pre-pandemic levels for fresh meat, pulling up total meat volume sales to nearly 1% above pre-pandemic levels despite prices being up 25% over this same time period.
Meat sales are setting in to a fairly steady pattern going into the holiday season with celebration having been very home centric in recent years.
 Assortment
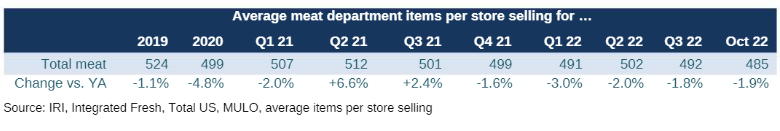
Fewer items had to work harder to achieve the same level of sales. At an average of 485 items per store, assortment dropped to its lowest levels since 2020, with continued year-on-year declines. Compared with 2021, the average number of items per store were down 1.9%, but compared with pre-pandemic levels, items were down by 6.2%. It is the processed meat side that is driving most of the longer-term decline. At an average of 305 item per store in October 2022, items were down 8.9% versus pre-pandemic levels. Year-on-year, assortment is tighter on the fresh meat side, down 2.6% in average items per store.
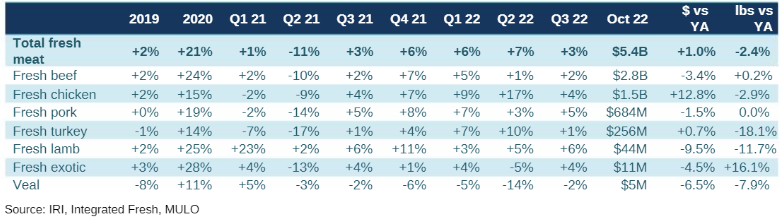
Fresh meat by protein
Total fresh meat sales were up 1.0% in October 2022 versus year ago. Chicken delivered big, but this was inflation driven. Beef and pork, that had a decrease in the average price per pound/unit, experienced slight year-on-year declines in dollars, but held steady in pounds.
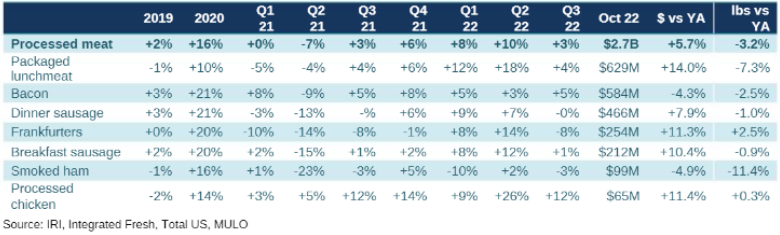
Processed meat
Packaged lunchmeat, frankfurters and processed meat led dollar growth in October 2022 versus year ago. However, in the case of packaged lunchmeat, it is driven by substantial increases in price, whereas frankfurters and processed chicken increased by a combination of inflation and increased year-on-year demand.
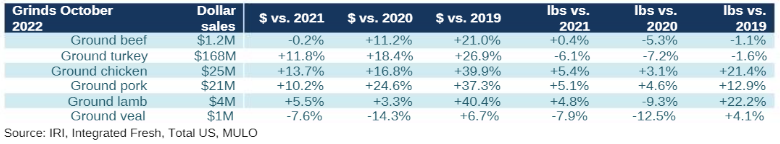
Grinds
Grinds generated $1.4 billion in the five October weeks, with 84% of dollars and pounds being generated by ground beef. Despite being a massive seller, ground beef matched last year’s volume sales. Ground turkey had high dollar gains but fell 6.1% behind on pounds.
What’s next?
The holiday season is around the corner and consumers are split between being excited to have something to celebrate and pulling back on spending given the reduction in purchasing power.
For instance, thinking about Thanksgiving, 32% feel the same as last year, 20% look forward to having something to celebrate after a stressful year, 17% are worried about being able to afford the type of celebration they usually have because of inflation and 5% do not plan to celebrate at all. Among celebrants, hosting or attending a meal with extended family or friends is the most popular plan (35%), followed by preparing a special meal for the household (31%).
The numbers of Christmas, New Year’s, etc. are similar, with dinner plans for the household or an extended group being the most common way to celebrate.
The next performance report in the IRI, 210 Analytics and Marriner Marketing series will be released mid-December to cover the November sales trends.
Please thank the entire meat and poultry industry, from farm to store, for all they do.
Date ranges:
2019: 52 weeks ending 12/28/2019
2020: 52 weeks ending 12/27/2020
Q1 2021: 13 weeks ending 3/28/2021
Q2 2021: 13 weeks ending 6/27/2021
Q3 2021: 13 weeks ending 9/26/2021
Q4 2021: 13 weeks ending 12/26/2021
Q1 2022: 13 weeks ending 3/27/2022
Q2 2022: 13 weeks ending 6/26/2022
Q3 2022: 13 weeks ending 9/25/2022
September 2022: 4 weeks ending 9/25/2022
October 2022: 5 weeks ending 10/30/2022
Looking for a reprint of this article?
From high-res PDFs to custom plaques, order your copy today!


