Inflation takes a big bite out of the meat dollar in August
Consumers are feeling the pain and making changes to their restaurant engagement and grocery purchases, a survey of grocery shoppers suggests.
Food inflation remains extremely high and consumers are feeling the pain. They are making changes to their restaurant engagement as well as their grocery purchases, according to the August IRI survey of primary grocery shoppers.
- When purchasing groceries, 85% of consumers shopped in person. Online shopping was near equally divided between click-and-collect (9%) and home delivery (6%). Delivery is more prevalent among Gen Z and younger Millennials, at 13%. Shoppers are not expecting a major change in their in-person versus online shopping: 4% expect they will buy all groceries online in the next few weeks and months, while 66% believe they will buy all groceries in person. The estimates among the remaining 30% range from expecting to buy most groceries to only some online.
- 81% of American households bought at least one restaurant meal in August, with the highest restaurant penetration among Gen X, at 85%. Takeout continues to be big, with 54% having ordered meals to go. Half of American households have eaten restaurant food on premise. Additionally, 20% have ordered from a restaurant for home delivery. Home delivery is much more popular among Gen Z and younger Millennials, at 31%. This means that restaurant meals are not off the table, but consumers are more strategic about when they eat out and what they order.
- Spending continues to be affected by out-of-stocks, with shoppers mentioning examples ranging from carbonated drinks to eggs, milk and chicken. At the same time, when items are available for purchase, 42% stock up on staples out of concern for rising prices or the item being unavailable next time they shop. This may bring further imbalance to an already strained system and has prompted some retailers to re-instate purchase maximums on items such as chicken breasts once more.
- 89% of consumers remain worried about the elevated gasoline prices and 94% are concerned about food inflation. They list examples from departments across the store as being significantly more expensive. The list is led by eggs, but includes meat, produce, milk, snacks, paper products and more. Eight in 10 shoppers (78%) are making changes to their shopping choices due to increased prices. The most popular money-saving measure is looking for sales/deals more often (50%), followed by cutting back on non-essentials (41%), looking for coupons and buying store-brand items more often (31%, each). Despite the high gasoline prices, 15% switched some of their shopping to a lower-cost retailer and/or visit multiple stores to get the best deals. This cherry-picking behavior may be driven by 53% of consumers reporting that fewer of the items they are looking for are on sale and 50% feel that items are not discounted as much as they used to be.
- IRI sales data corroborates this shifting in channel choices with traditional supermarkets having lost share this year in favor of value-based formats, including clubs and supercenters.
Prolonged supply chain, labor, transportation and weather challenges in combination with a sharpening consumer reactions to the high food inflation is resulting in an ever-changing nature of the marketplace, IRI, 210 Analytics and Marriner Marketing continue to team up to bring the latest trends and analysis relative to meat department sales, including fresh and processed items.
Inflation insights
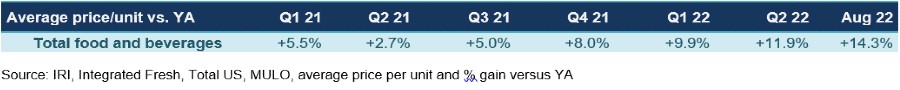
The price per unit across all foods and beverages in the IRI-measured multi-outlet stores, including supermarkets, club, mass, supercenter, drug and military, accelerated further to an increase of 14.3% in the four weeks ending August 28th, 2022 (“August”) versus year ago. This is up from +13.3% in July. August inflation was +16.6% in the center of the store (grocery) and +13.3% for perishables. Compared with August 2019, prices across all foods and beverages were up 27.4%.
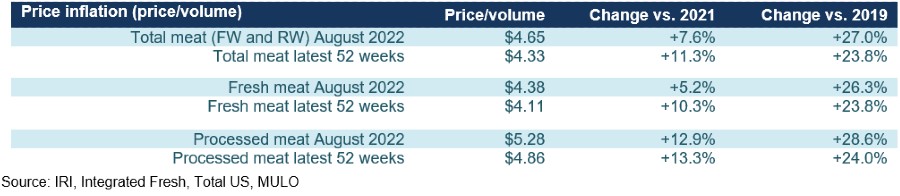
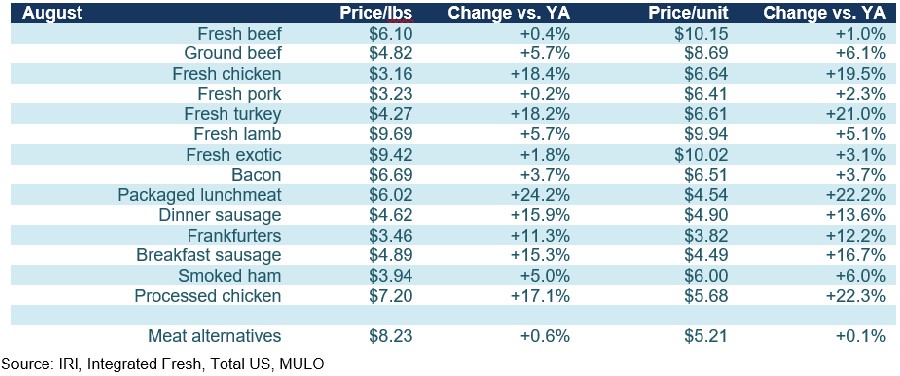
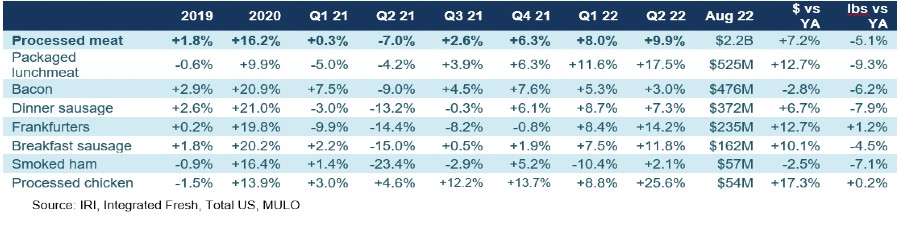
The average price per pound in the meat department across all cuts and kinds, both fixed and random weight, stood at $4.65 in August 2022, which was up nine cents from the July level and up 7.6% versus year ago. This means meat had below-average inflation compared to total foods and beverages. In the past few months, meat inflation has been milder than the 52-week average, indicating that the increases are moderating. Inflation in processed meat did stay in the double digits, at +12.9% in August 2022.
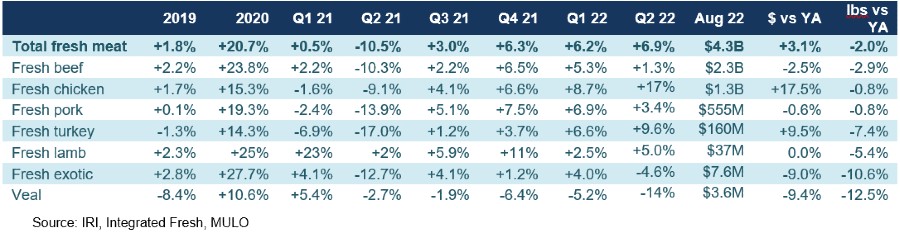
 On the fresh meat side, August inflation was highest for chicken and turkey while beef and pork prices were stable. Processed meat items averaged double-digit inflation across all items, with the exception of bacon and smoked ham.
Meat sales August 2022
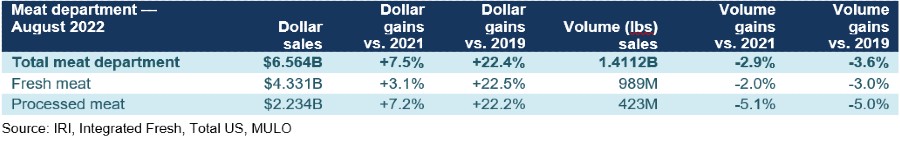
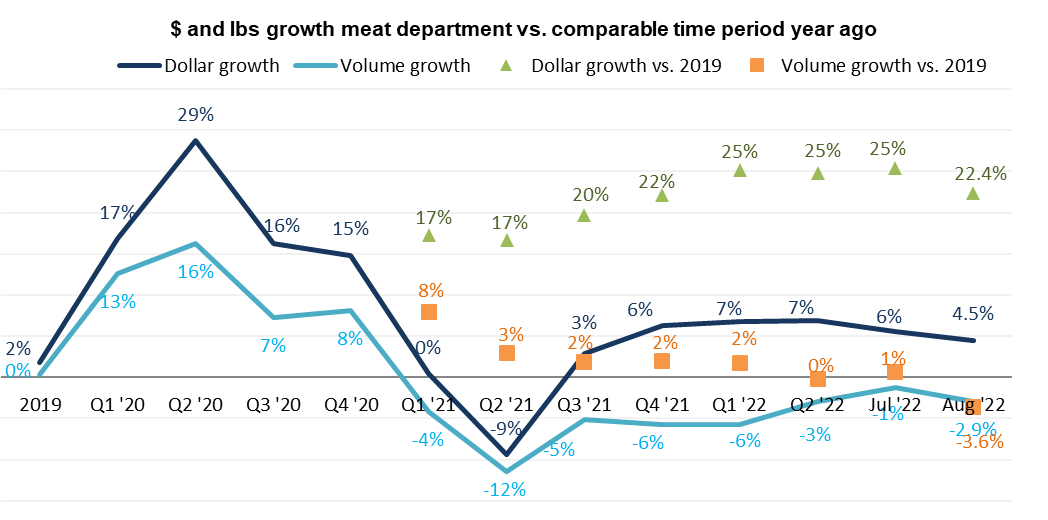
While dollars stayed ahead of prior year levels, volume was unable to keep pace with August of 2021. Additionally, August volume dropped back below the pre-pandemic pound sales at a level not yet seen before (-3.6%). The difference with July could lie in the lack of major holidays as well as continued supply chain and labor challenges that are leaving some retailers with sparse inventory, especially in chicken.
The down August performance put an abrupt end to the sales trend line that has moved volume closer to year ago levels since the beginning of the year. The year-on-year volume decline of -2.9% was the steepest since the second quarter of 2021 when sales went up against the incredible early pandemic peaks. Additionally, volume versus 2019, at -3.6%, was a profound drop from the 0% to 3% growth seen between the second quarter of 2021 and July 2022.
 Assortment
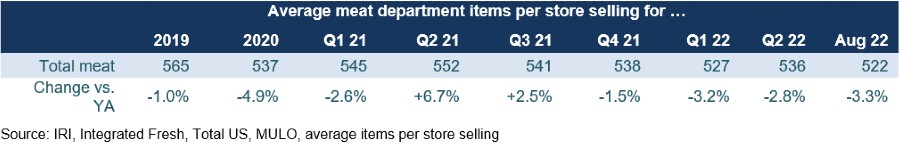
The weak August performance was undoubtedly related to the sharp drop in assortment. The average number of items per week stood at 522 in August, down from an average of 536 in the second quarter. Year-on-year, assortment was down 3.3% and the average number of items per store dropped by 6.6% when compared to 2019. The biggest loss is seen in processed items that are down to 328 items, down 9.8% from pre-pandemic.
Fresh meat by protein
Total fresh meat sales were up 3.1% in August. Poultry delivered big, but this was inflation driven. Beef and pork, that had much milder inflation, experienced slight year-on-year declines in both dollar and pound sales.
Processed meat
Processed meat dollars grew over the 2021 sales levels by +7.2% in August 2022. Packaged lunchmeat, sausage, hot dogs and processed chicken gained, whereas bacon and smoked ham were unable to meet the 2021 sales levels. In pounds, all areas were down year-on-year with the exception of hotdogs and processed chicken, which includes items such as refrigerated chicken strips and nuggets that are typically found in the self-serve meat case.
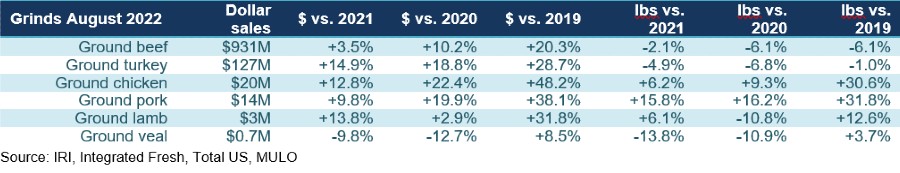
Grinds
August sales were dominated by ground beef and turkey, but all grinds with the exception of ground veal increased in dollars. The pound performance was mixed. Ground beef and turkey lost ground versus year ago, whereas ground pork experienced a 16% increase to reach 3.8 million pounds. Ground lamb and veal experienced year-on-year volume declines in the double digits.
What’s next?
The BLS Consumer Price Index is pointing to some month-over-month moderation in areas other than food. However, year-on-year, prices continue to be significantly higher with little relief in sight. Supply chain and labor challenges also continue to challenge in-stock rates and retailers’ ability to promote. Unit and volume pressure has worsened across most department as consumers are pulling back on spending. But at the same time, it is not a universal race to the bottom, but rather a careful balancing act between opportunities to save versus occasions and items worth the splurge.
These patterns are likely to persist as inflationary pressure has accelerated since the fall of 2021. The August IRI survey found that:
- 32% of Americans are having difficulty affording needed groceries.
- Additionally, 43% of American households say their financial health is strained, nearly the same number as the 45% who say their financial situation is a lot or a little worse off than a year ago.
- The outlook for next year is mixed. While 30% believe their financial situation will be worse off, 28% believe they will be doing financially better.
The next performance report in the IRI, 210 Analytics and Marriner Marketing series will be released mid-October to cover the September sales trends.
Please thank the entire meat and poultry industry, from farm to store, for all they do.
Date ranges:
2019: 52 weeks ending 12/28/2019
2020: 52 weeks ending 12/27/2020
Q1 2021: 13 weeks ending 3/28/2021
Q2 2021: 13 weeks ending 6/27/2021
Q3 2021: 13 weeks ending 9/26/2021
Q4 2021: 13 weeks ending 12/26/2021
Q1 2022: 13 weeks ending 3/27/2022
Q2 2022: 13 weeks ending 6/26/2022
August 2022: 4 weeks ending 8/28/2022
Looking for a reprint of this article?
From high-res PDFs to custom plaques, order your copy today!