Softening inflation pulls January meat dollars below year-ago levels
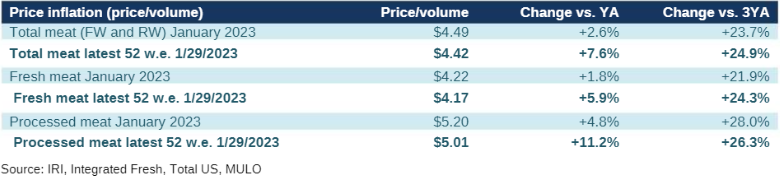
Average price per pound across the meat department stands at $4.49 in January 2023.
January brought a host of New Year’s resolutions with 40% in the IRI primary shopper survey planning to eat healthier, 24% aiming to get more sleep and 23% wanting to spend more time with friends and family. However, saving more money was the second highest resolution, at 35% — demonstrating that inflation continues to make its mark. To understand the total market impact, IRI, 210 Analytics and Hillphoenix will continue to bring monthly updates in 2023 to understand the latest meat department trends.
In-store shopping remained prevalent, at 85% of trips. Two-thirds of shoppers exclusively buy in-store, whereas 11% buy most or all groceries online. Nine in 10 consumers perceive the cost of groceries and everyday household items to be much (67%) or somewhat (22%) higher than last year, according to the IRI survey. Eggs continue to lead the list of examples cited by consumers for being more expensive, followed by milk, beef/pork, fresh produce, chicken/turkey and bread. Inflationary pressure on income is real, with 96% being concerned over the high cost of groceries.
- This is prompting continued money-saving measures when buying groceries among 79% of Americans, such as buying what’s on sale (49%), cutting back on non-essentials (41%), looking for coupons (33%) and switching to store brand items (31%).
- At the same time, consumers continue to report that they are seeing fewer items on sale (54%) and the items on sale not being discounted as much (45%).
- 45% stock up on certain items out of concern that prices may rise further or they might not be available.
Special occasions remain a big opportunity for food retail in 2023. During the pandemic years, several foodservice holidays, such as Valentine’s Day and Mother’s Day, turned home-centric. This moved significant spending into retail, adding to holidays that were already mostly celebrated at home, such as Labor Day and the Fourth of July. Holidays typically boost spending far above a normal week with opportunities for departments around the store.
- The January IRI survey found that 55% of shoppers planned to watch the Super Bowl this year of which only 2% were planning to watch it at a bar or restaurant. Households celebrating in at-home settings estimated that they would spend around $42 on food and beverages for the event, up from $34 last year. Super Bowl is the largest selling occasion for items like avocados and chicken wings.
- Fifty percent of Americans plan to celebrate Valentine’s Day, with 19% planning to cook a special meal at home and 15% planning to go out to a restaurant. Sixteen percent of consumers are staying home specifically to save money.
- Thinking ahead to the April holidays of Easter or Passover, 28% plan to prepare a special meal for the household and 30% will host or attend a meal with extended family or friends. The typical party size continues to increase, from an average of 7.4 in 2022 to 7.9 in 2023. Shoppers are trying hard to keep spending flat (49%) with only 20% expecting to spend more, which may mean continued pressure on units and volume.
Following the typical December uptick in the estimated share of meals prepared at home (81.5%), consumers estimated that 80% of meals were prepared at home in January. Restaurant engagement was fairly steady, with 78% of households having purchased restaurant food at least once, according to the January survey.
Inflation insights
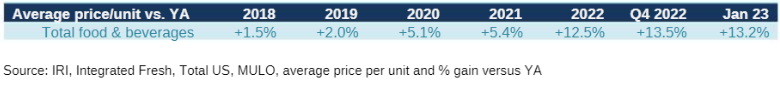
The price per unit across all foods and beverages in the IRI-measured multi-outlet stores, including supermarkets, club, mass, supercenter, drug and military, increased 13.2% in January 2023 (the four weeks ending 1/29/2023), which was up from 12.8% in December 2022. Comparing January 2023 to January 2020, prices across all foods and beverages were up 30.3%.
The average price per pound in the meat department across all cuts and kinds, both fixed and random weight, stood at $4.49 in January 2023. Prices only increased slightly year-on-year, at +2.6% — continuing a trend of moderating levels of inflation that started in the second half of 2022. As such, meat and poultry inflation was far below the January average for total food and beverages. Yet, red meat and poultry were among the top five examples cited by consumers when naming products that costs more now than they did last year. As perception is reality, it will be important to continue to underscore value and versatility.
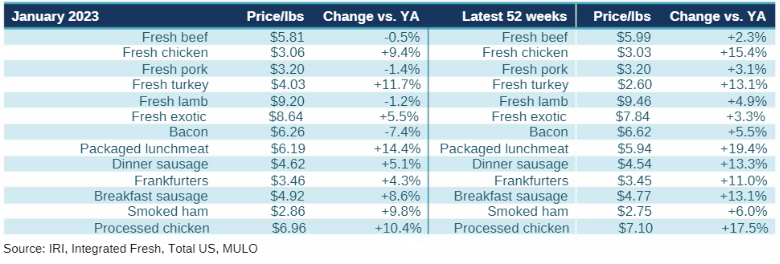
By protein, the moderation in price increases is driven by beef, pork, lamb and bacon in January 2023. Chicken inflation dropped to single digits for the first time in months, while prices for fresh turkey were 11.7% higher than in January last year. In the 52-week view, most of the processed meat category averaged double-digit price increases, led by packaged lunchmeat, that was up 19.4% versus last year.
Meat sales
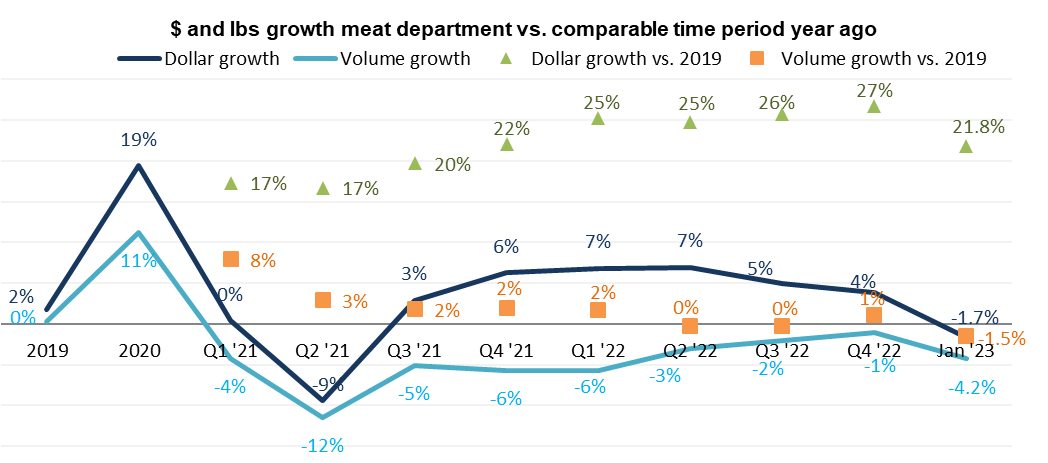
January meat sales were somewhat subdued. Dollars, units and volume sales were down for both fresh and processed meat. In the 52-week view, dollar sales remain ahead of year ago levels, but pounds are trending behind. Compared to the pre-pandemic normal pound sales are still ahead.
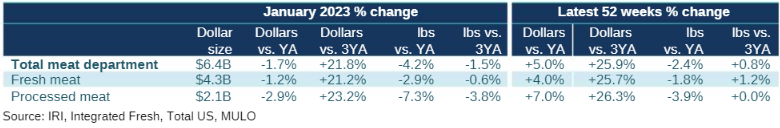
January 2023 sales were affected by the below-average rate of inflation that did not provide the same boost seen in prior months plus subdued demand. Pound sales dropped 4.2% behind year ago levels. January pound sales were also down when compared to their January 2020 levels, the pre-pandemic normal, by 1.5%.
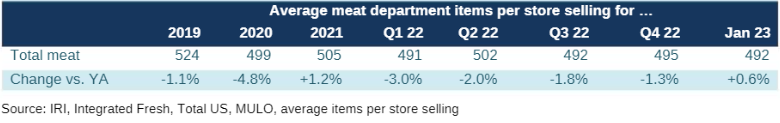
Assortment
Assortment, measured in the number of weekly items per store is averaging 492 meat and poultry SKUs. This is around year ago levels, but down 5.0% from January 2020.
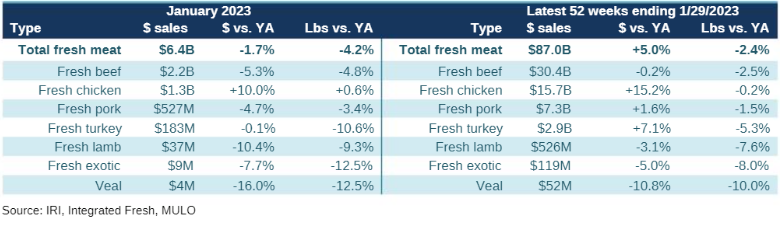
Fresh meat by protein
In all, fresh meat sales decreased 1.7% in January as the much lower level of inflation could not offset the reduction in pound sales. Beef and chicken were the big contributors to January fresh meat sales, that totaled $4.7 billion. Chicken experienced an uptick in pounds and dollars in January and came very close to matching last year’s pound sales in the 52-week view.
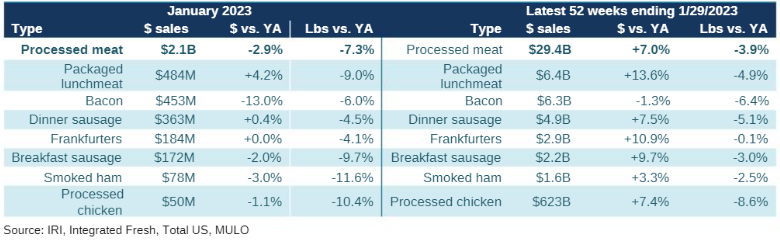
Processed meat
In January, both dollar and pound sales were down when compared to January 2022. Bacon sales declined by double digits as a result of deflation and weaker demand. In the 52-week view, dollar sales did remain ahead of year ago levels, but pound trailed by 3.9%. Frankfurters came closest to matching last year’s pound sales.
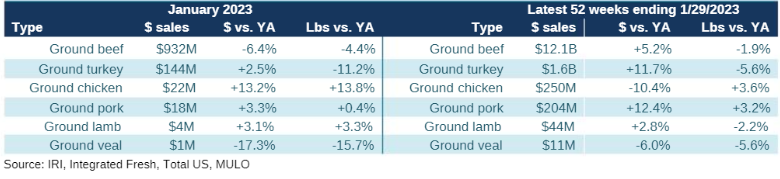
Grinds
Grinds generated $1.1 billion in the four January weeks, with 84% of dollars and pounds being generated by ground beef. However, dollars and pounds were down for the biggest seller, whereas pork, chicken and lamb grinds gained in both dollars and pounds. For the full calendar year, grinds totaled $14.2 billion with pound gains for both chicken and pork.
What’s next?
The first quarter of 2023 looks to be little different from 2022. Consumers remain worried about inflation and money-saving measures continue to pressure units and volume. While unit sales remain ahead of 2019 for most departments, the year-on-year unit pressure is high. Ingredient inputs, weather and transportation conditions remain areas of concern as prices are lapping the double-digit increases of 2022.
The next performance report in the IRI, 210 Analytics and Hillphoenix series will be released mid-March 2023 to cover the February sales trends, including Super Bowl and Valentine’s Day.
Please thank the entire meat and poultry industry, from farm to store, for all they do.
Date ranges:
2019: 52 weeks ending 12/28/2019
2020: 52 weeks ending 12/27/2020
2021: 52 weeks ending 12/26/2021
2022: 52 weeks ending 1/1/2023
Q4 2022: 13 weeks ending 1/1/2023
January 2023: 4 weeks ending 1/29/2023
Looking for a reprint of this article?
From high-res PDFs to custom plaques, order your copy today!


