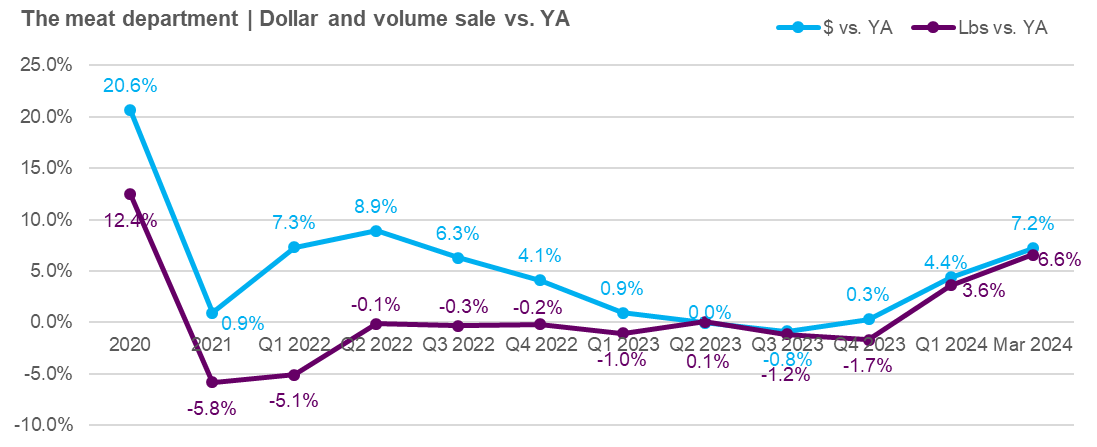
Meat department achieves 3.6% year-on-year gain in pounds sold for Q1 2024
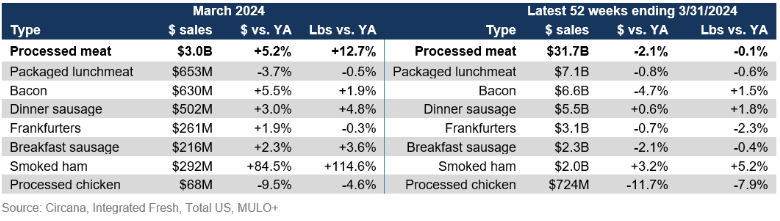
March 2024 processed meat sales were less than half that of fresh meat.
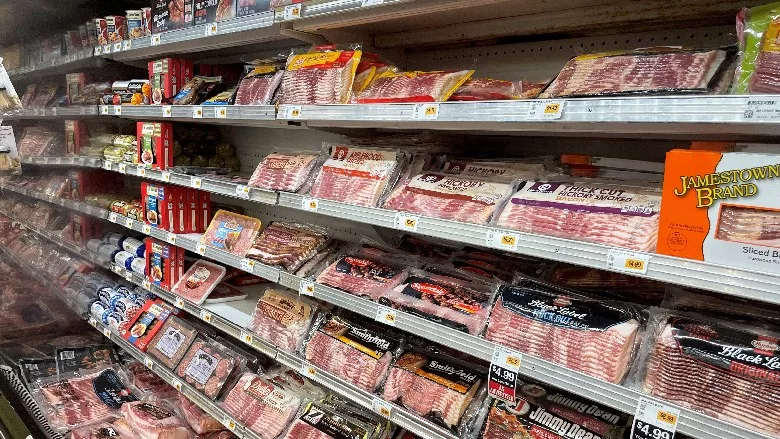
Photo credit: Fred WIlkinson
The March Consumer Price Index reflected the ongoing rise of inflation in foodservice. Restaurant price increases have been outpacing broader inflation for quite a while now.
- The March food-away-from-home inflation was up 0.3% from the previous month and 4.2% versus March 2023. In contrast, grocery prices increased 1.2% year-on-year. Yet, the cumulative impact of prices has 95% of consumers somewhat or very concerned about grocery prices, according to the March Circana survey of grocery shoppers.
- The USDA released its forecast for 2024 which shows more of the same: above-average inflation for food-away-at-home. The most recent performance survey by the National Restaurant Association predicts further headwinds for foodservice. More than half of restaurant operator respondents said same-store sales were down year-on-year compared to only 17% noting a decrease in same-store sales this time last year.
- Easter was very early this year, shifting much of the holiday dollars into the first quarter of the year — challenging the March and April year-over-year comparisons. As of early March, 54% expected to celebrate Easter or Passover with a special meal, averaging six to seven people around the table. Two in 10 shoppers expected to spend more than they did last year. Much of the holiday shopping has moved back to the holiday week itself.
Inflation insights
In March 2024 (the five weeks ending 3/31/2024), the price per unit across all foods and beverages in the Circana MULO+ universe increased 1.4% versus March 2023. The expanded MULO+ universe includes additional retailers in the e-Commerce, grocery, club, DTC delivery and other channels, fueling an average expansion of 15% across total CPG. All time period history and geographies have been updated to MULO+.
Prices in the fresh perimeter were up 1.2% in March versus year ago, whereas center-store grocery prices increased 1.6%. The March prices across food and beverages were 35% higher than they were pre-pandemic.
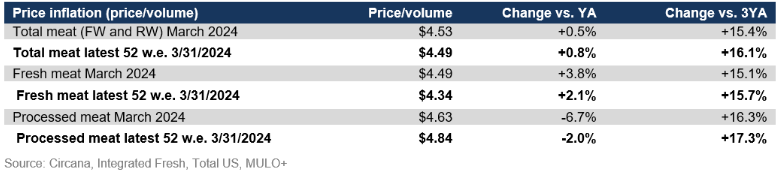
The average price per pound in the meat department across all cuts and kinds, both fixed and random weight, stood at $4.53 in March, up 0.5% from year-on-year. Processed meat tends to have the higher prices, but its average price per pound decreased.
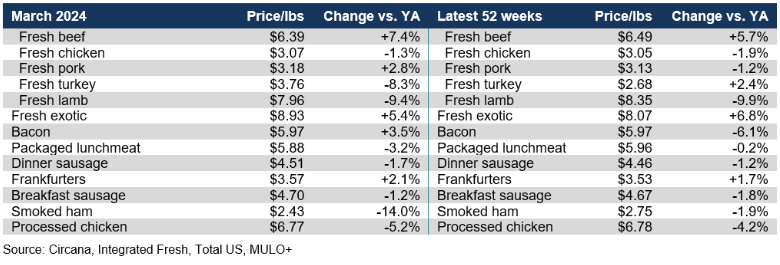
March brought year-on-year deflation for the vast majority of fresh and processed categories. Beef inflation accelerated, with the average price per pound at retail up 7.4%.
Meat sales
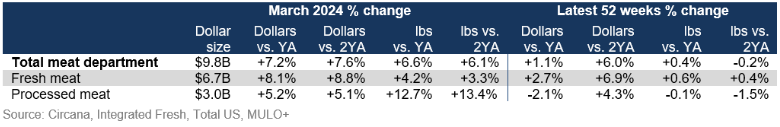
Pound gains continued in March, which was expected given the earlier Easter timing, showing an overall March increase of 6.6%, with a slightly higher gain for dollars.
The five March weeks show that even though the two weeks leading up to the holiday prompted much of the volume growth, the first three weeks also experienced an increase in pound sales. In the MULO+ universe, meat department volume sales trailed year ago levels throughout 2023, but the first quarter of 2024 was strong (though keeping in mind the Easter shift).
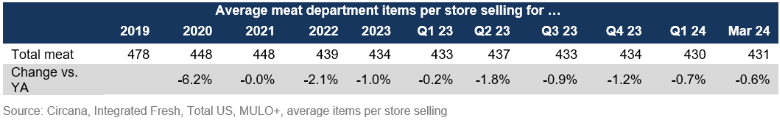
 Assortment
Meat department assortment, measured in the number of weekly items per store, averaged 431 SKUs in March 2024 — holding steady around 40 to 50 items below pre-pandemic levels.
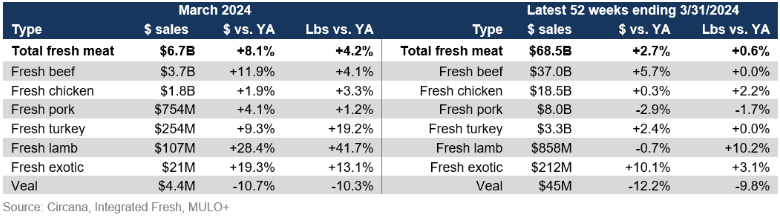
Fresh meat sales by protein
Fresh experienced a strong performance in March, with pound gains for all major proteins with the one exception of veal, which is a very small seller. In the full year view, both dollars and pounds moved into the plus. The shift in the holiday timing can be seen in lamb, that had a 41.7% increase in pound sales.
Processed meat
March processed meat sales were less than half that of fresh meat, at $3.0 billion. Dollar sales were up 5.2%, but boosted by a big spike in smoked ham sales, pounds increased double digits over last year. As one of the major Easter classics, smoked ham generated nearly $300 million in March.
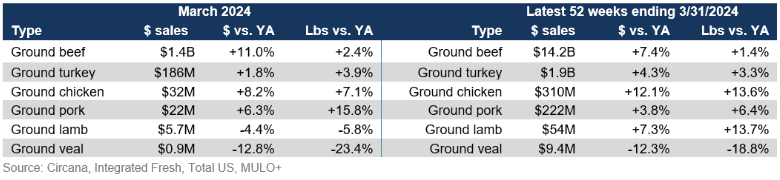
Grinds
The strong beef performance was driven by ground beef, which had a 2.4% increase in pounds. All smaller grinds, including turkey, pork and chicken, gained in both pounds and dollars in March as well.
What’s next?
The ongoing financial concern among consumers combined with accelerated foodservice inflation will likely result in a continued home-centric, and therefore, retail-centric food and beverage landscape.
- While a home-centric environment, 84% of consumers apply one or more money-saving measures. According to the March Circana survey, 57% of consumers cope with the higher prices by looking for sales specials more often and 36% use coupons more frequently. Additionally, 44% say they cut back on non-essentials and 34% switch to store brands where possible.
- However, the big impact on units and volume is starting to subside with total food and beverage sales increasing unit sales by 1.5% in the first quarter of 2024 when compared to 2023.
- Special occasions remain a time to splurge for many consumers.
- Looking ahead to Memorial Day, 56% of consumers already expect to enjoy holiday activities, such as getting together with friends or family (31%) or hosting a barbecue (20%).
- Also consider events such as March Madness where several record-setting games in viewership made the 2024 tournament the most watched ever. Whether F1 racing, the Kentucky Derby, the Masters or the Olympics coming up in Paris this summer, sporting events can be important times for the meat department to engage with shoppers.
The next performance report in the Circana, 210 Analytics and Hillphoenix series will be released mid-May 2024 to cover the April sales trends.
Date ranges:
2023: 52 weeks ending 12/31/2023
Q1 2024: 13 weeks ending 3/31/2024
March 2024: 5 weeks ending 3/31/2024
Looking for a reprint of this article?
From high-res PDFs to custom plaques, order your copy today!


