Meat performance strengthens in September
Sharpening consumer reactions to high food inflation fuel an ever-changing marketplace.
Life remained home-centric in late summer, with an estimated 78% of all meal occasions being prepared at home, according to the September IRI primary shopper survey. While this is down 10 points from the very start of the pandemic, the high inflationary levels are keeping the food dollar largely at retail. Consumers are still ordering restaurant meals, but not as often as before plus they are making changes to what they order with an eye on the check total.
- 82% of American households bought at least one restaurant meal in September, with the highest restaurant penetration among higher-income households, at 91%. Only 69% of households who are earning less than $25,000 annually ate at restaurants at least once in September. Restaurant engagement is also lower in the Midwest and among older shoppers.
- Takeout continues to be big, with 54% having ordered meals to go in September. Half of American households have eaten restaurant food on premise. Additionally, 18% have ordered from a restaurant for home delivery (down two points from August). Home delivery is much more popular among high-income households as well as the youngest shoppers. For October, 54% of consumers expect they will eat out as often, while 24% believe they will cut back on restaurant spending further.
- When purchasing groceries, 83% of consumers shopped in person, down from 85% in August. Online shopping was near equally divided between click-and-collect (10%) and home delivery (8%). Shoppers are not expecting a major change in their in-person versus online shopping: 4% expect they will buy all groceries online in the next few weeks and months, while 68% believe they will buy all groceries in person. The estimates among the remaining 28% range from expecting to buy most groceries (8%) to only some (7%) online.
- Spending continues to be affected by out-of-stocks, with 38% of shoppers mentioning examples of items they meant to buy but were unavailable, ranging from carbonated drinks to milk, canned goods, eggs and chicken. This leads to shoppers substituting, switching stores or abandoning the intended purchases altogether — all affecting sales. At the same time, when items are available for purchase, 40% of shoppers stock up on staples out of concern for rising prices or the item being unavailable next time they shop.
- In line with reality, price perceptions remain high with 94% believing grocery prices are somewhat or a lot more than before. Equally as many are concerned about food inflation. Eight in 10 shoppers (78%) are making changes to their shopping choices due to increased prices. The most popular money-saving measures are looking for sales/deals more often (49%), cutting back on non-essentials (43%), looking for coupons (30%) and buying store-brand items more often (28%). Despite the high gasoline prices, 15% switched some of their shopping to a lower-cost retailer and/or visit multiple stores to get the best deals. This cherry-picking behavior may be driven by 55% of consumers reporting that fewer of the items they are looking for are on sale and 44% feel that items are not discounted as much as they used to be.
Prolonged supply chain, labor, transportation, global market and weather challenges in combination with a sharpening consumer reactions to the high food inflation is resulting in an ever-changing nature of the marketplace, IRI, 210 Analytics and Marriner Marketing continue to team up to bring the latest trends and analysis relative to meat department sales, including fresh and processed items.
Inflation insights
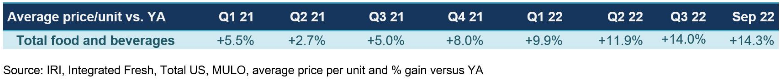
The price per unit across all foods and beverages in the IRI-measured multi-outlet stores, including supermarkets, club, mass, supercenter, drug and military, increased 14.0% over the third quarter of 2022 and 14.3% in the month of September (the four weeks ending 9/25/2022). September inflation was +17.4% in the center of the store (grocery) and +12.3% for perishables. Compared with August 2019, prices across all foods and beverages were up 27.9%.
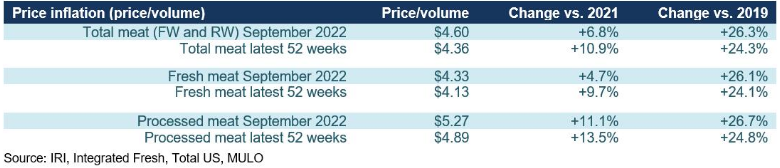
 The average price per pound in the meat department across all cuts and kinds, both fixed and random weight, stood at $4.60 in September 2022 — continuing a trend of deceleration price increases. This is also illustrated by the month-over-month inflation being up 6.8% versus the latest 52-week view showing a 10.9% increase. This also means meat had below-average inflation compared to total foods and beverages, especially on the fresh meat side. Inflation in processed meat did stay in the double digits, at +11.1% in September 2022.
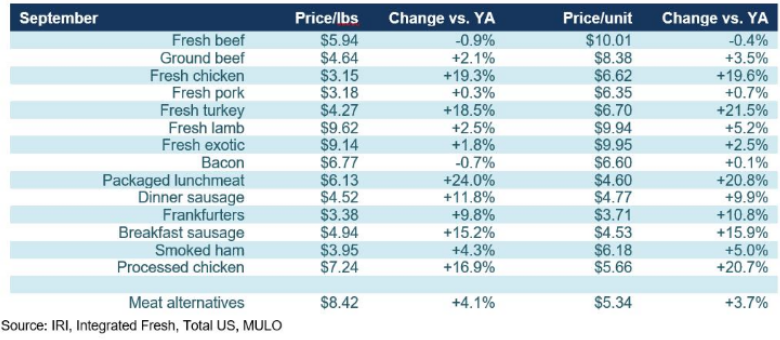
The moderation in price increases is driven by beef, pork, lamb, exotic (including bison) and bacon. On the other hand, both chicken and turkey continued to experience double-digit inflation. Packaged lunchmeat had the highest increases of all, at +24.0% over September 2021 levels
 Meat sales September 2022
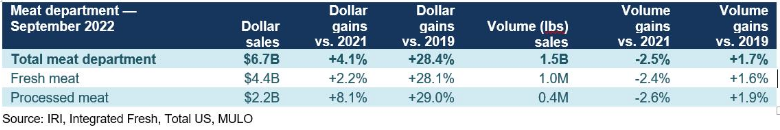
September sales looked much better than August. Dollars exceeded prior year levels by 4.1% and volume sales were within 2.5% of last year. Additionally, September volume moved significantly ahead of the 2019 pre-pandemic levels for both fresh and processed meat.
The down August performance was offset by the much better September performance to average out the third quarter on a positive note. Volume sales remained at 2019 levels while dollars were 26% higher. 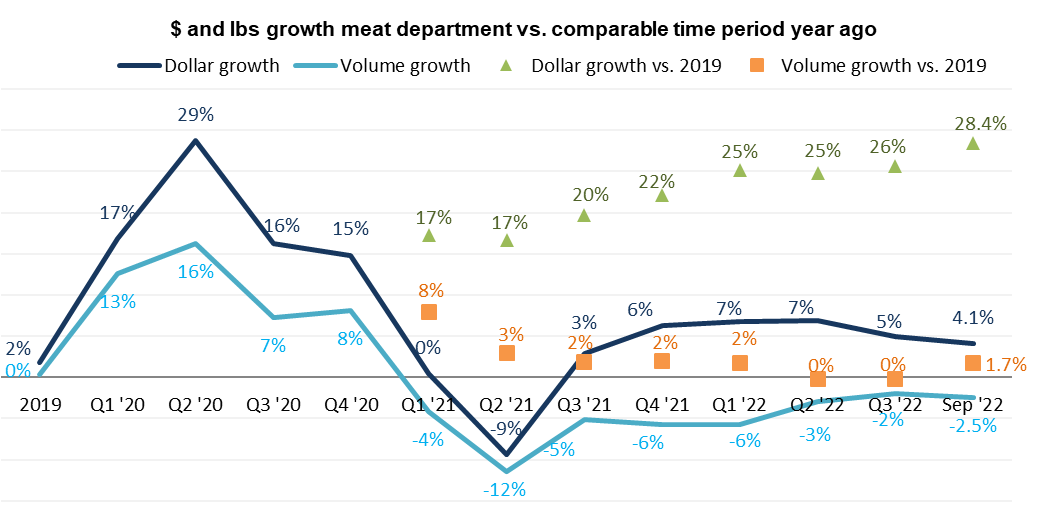
Assortment
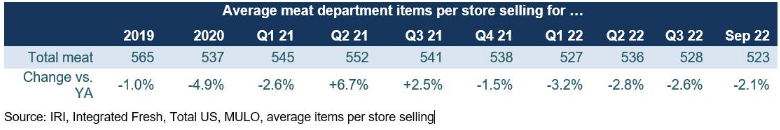
The much stronger sales results were achieved despite an even tighter assortment. In September 2022, assortment dropped to an average of 523 items per store — a new low. Year-on-year, this was a 2.1% decrease but items dropped 5.9% below 2019 levels. The biggest loss was seen in processed items that were down to 331 items, 9.1% fewer when compared to pre-pandemic.
Fresh meat by protein
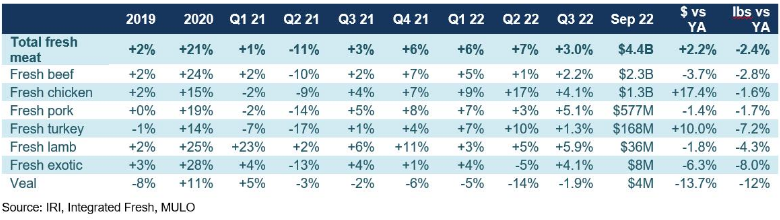
Total fresh meat sales were up 2.2% in September. Poultry delivered big, but this was inflation driven. Beef and pork, that had much milder inflation, experienced slight year-on-year declines in both dollar and pound sales.
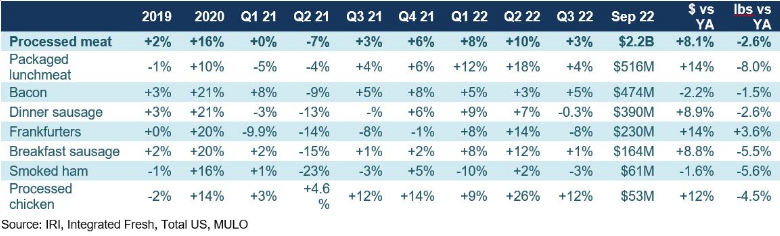
Processed meat
Processed meat dollars grew by +8.1% in September 2022 when compared to year ago. Packaged lunchmeat, sausage, hot dogs and processed chicken gained, whereas bacon and smoked ham were unable to meet the 2021 sales levels. In pounds, all areas were down year-on-year with the exception of hotdogs.
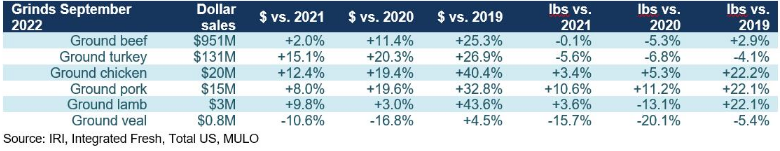
Grinds
Grinds generated $1.12 billion in September, with 85% of dollars being generated by ground beef. Despite being a massive seller, ground beef matched last year’s volume sales and increased 2% in dollars. Ground turkey had high dollar gains but fell 5.6% behind on pounds.
What’s next?
In 2020 and early 2021, American’s total credit card debt and average savings rates saw vast improvements. According to the Fed, credit card balances peaked at $927 billion in the fourth quarter of 2019, followed by five consecutive quarters of decreases as the COVID-19 pandemic set in. Credit card debt bottomed out at $770 billion in the first quarter of 2021. Since then, credit card balances have risen to $856 billion, just 7.7% below the all-time record. Expectations based on the trend lines are that credit card debt will reach a new high in the next few months. This is particularly important in the light of the Federal Reserve having raised the prime rate several times this year in an effort to dampen inflation.
At the same time, the National Savings Rate has fallen far below pre-pandemic levels, according to the Bureau of Economic Analysis. In August 2022, the average U.S. savings rate as a percentage of disposable income was 3.5% — about half that of the pre-pandemic average. Unlike the early months of the pandemic, that means consumers have been subsidizing income with credit cards or have less income left after paying taxes and spending on essentials in the light of the 40-year high inflation.
The marketplace is impacting consumer sentiment. The University of Michigan Consumer Sentiment (UMSCENT) dropped 20% versus year ago to its lowest levels in many decades, at 51.5, with an index of 100 being neutral.
In totality, consumers are reacting with a pullback on units and volume to manage their spending. But at the same time, baskets still contain items focused on value, convenience and premiumization rather than consumers shopping on price alone.
These patterns are likely to persist as inflationary pressure remains extremely high. The September IRI survey found that:
- 44% of Americans say their financial situation is a little or a lot worse off than a year ago.
- 27% of Americans do expect their financial situation to be better one year from now.
The next performance report in the IRI, 210 Analytics and Marriner Marketing series will be released mid-November to cover the October sales trends.
Please thank the entire meat and poultry industry, from farm to store, for all they do.
Date ranges
2019: 52 weeks ending 12/28/2019
2020: 52 weeks ending 12/27/2020
Q1 2021: 13 weeks ending 3/28/2021
Q2 2021: 13 weeks ending 6/27/2021
Q3 2021: 13 weeks ending 9/26/2021
Q4 2021: 13 weeks ending 12/26/2021
Q1 2022: 13 weeks ending 3/27/2022
Q2 2022: 13 weeks ending 6/26/2022
Q3 2022: 13 weeks ending 9/25/2022
September 2022: 4 weeks ending 9/25/2022
Looking for a reprint of this article?
From high-res PDFs to custom plaques, order your copy today!


