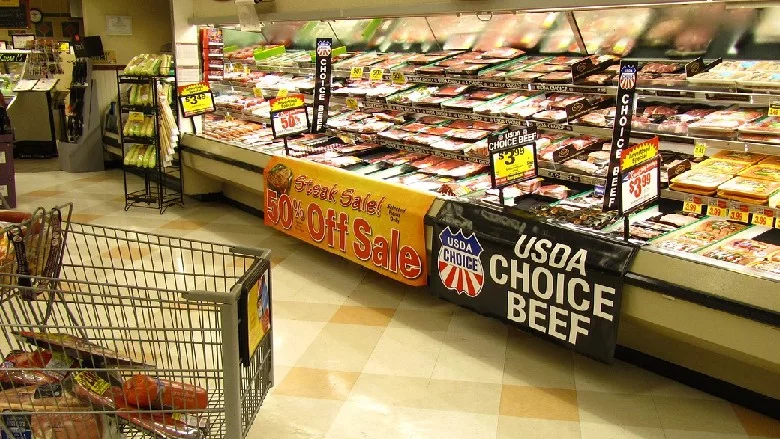
Meat department sales bounce back some in February
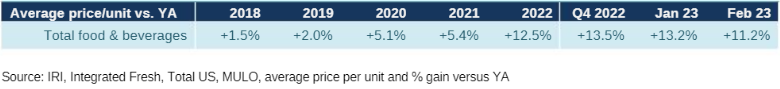
While inflation is moderating, the average price per unit across all food and beverages increased 11.2%.
While inflation is moderating month-over-month, the average price per unit across all food and beverages increased 11.2% year-over-year in February 2023 — continuing the long stretch of months with double digit increases. Salaries are not keeping pace, leading to continued concern and a host of money-saving measures among grocery shoppers. To understand the ongoing balancing act between time, money and nutrition goals, IRI, 210 Analytics and Hillphoenix will bring monthly updates in 2023 to understand the latest meat department trends.
- According to the February 2023 IRI primary shopper survey, 29% of Americans work from home one or more days per week, down from 41% in February 2022 and 47% in February 2021. As more workplaces are expecting employees to work onsite one or more days a week, the struggle for time is likely going to intensify in 2023. This means a growth opportunity for convenient, time-saving solutions, including value-added meat/poultry, heat-and-eat sides merchandised in the meat department, fully-cooked and deli-prepared meat and poultry. Oven-ready and air-fryer ready items are also popular among consumers.
- Restaurant takeout has become a bigger foodservice occasion than eating on premise. Per the February IRI survey, 50% of U.S. households have ordered takeout in the past few weeks versus 45% who ate on premise and 19% who ordered restaurant delivery. However, the vast majority of meals continue to be prepared at home, at a consumer-estimated 79.3%. Gen Z and younger Millennials prepare fewer at-home meals, at 76.4%, whereas meal preparation peaks among Boomers at 81.3% of meals. In the home-centric landscape, optimizing the share of meals with meat is the biggest growth opportunity for the retail meat department in 2023.
- In-store shopping remained prevalent, according to the February IRI survey, with 69% of shoppers exclusively buying grocery-type items in-store, whereas 12% buy most or all groceries online. Demographic gaps remain with online shoppers skewing younger and more affluent.
- Nine in 10 consumers perceive the cost of groceries and everyday household items to be much (70%) or somewhat (21%) higher than last year, per the IRI survey, of whom 95% are somewhat or extremely concerned about it. Eggs continue to lead the list of examples cited by consumers for being more expensive, followed by milk, beef/pork, fresh produce, chicken/turkey and bread.
- Both the share of Americans applying money-saving measures (84%) and the number of measures taken (averaging 3-4 per household) sharpened in January and February of 2023. The most popular ways to save remain buying what’s on sale (54%), cutting back on non-essentials (47%), looking for coupons (35%) and switching to store brand items (29%).
- At the same time, consumers continue to report that they are seeing fewer items on sale (55%) and the items on sale not being discounted as much (47%). When seeing deals, 45% of consumers stock up on certain items out of concern that prices may rise further or they might not be available on future trips.
- The survey found that 17% say their financial situation is a little or a lot better than last year, but 42% say they are a little or a lot worse off now than last year. Looking ahead to a year from now, 26% believe their financial situation will be better versus 32% believing it will be worse.
Inflation insights
The price per unit across all foods and beverages in the IRI-measured multi-outlet stores, including supermarkets, club, mass, supercenter, drug and military, increased 11.2% in February (the four weeks ending 2/26/2023), which was down from 13.2% in January 2023. Compared with February 2020, prices across all foods and beverages were up 30.2%.
 The average price per pound in the meat department across all cuts and kinds, both fixed and random weight, stood at $4.54 in February 2023. Prices only increased slightly year-on-year, at +2.8% — continuing a trend of moderating levels of inflation that started in the second half of 2022. As such, meat and poultry inflation was far below the February average for total food and beverages. Yet, meat and poultry were among the top five examples cited by consumers when naming products that costs more now than they did last year. As perception is reality, it will be important to continue to underscore value and versatility.
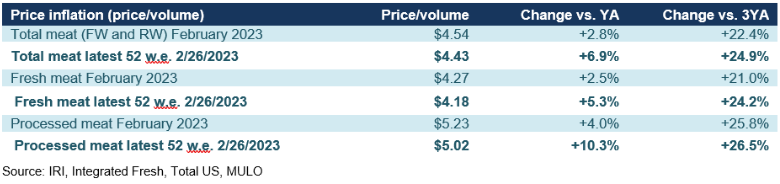
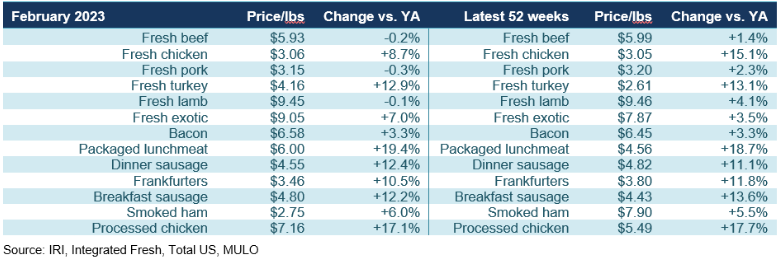
By protein, February prices decreased for beef, pork, and lamb when compared to February 2022. Chicken inflation remained in the single digits, while prices for fresh turkey were 12.9% higher than in February last year. In the 52-week view, most of the processed meat category averaged double-digit price increases, led by packaged lunchmeat, that was up 18.7% versus last year.
Meat sales
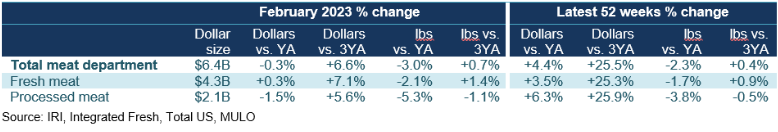
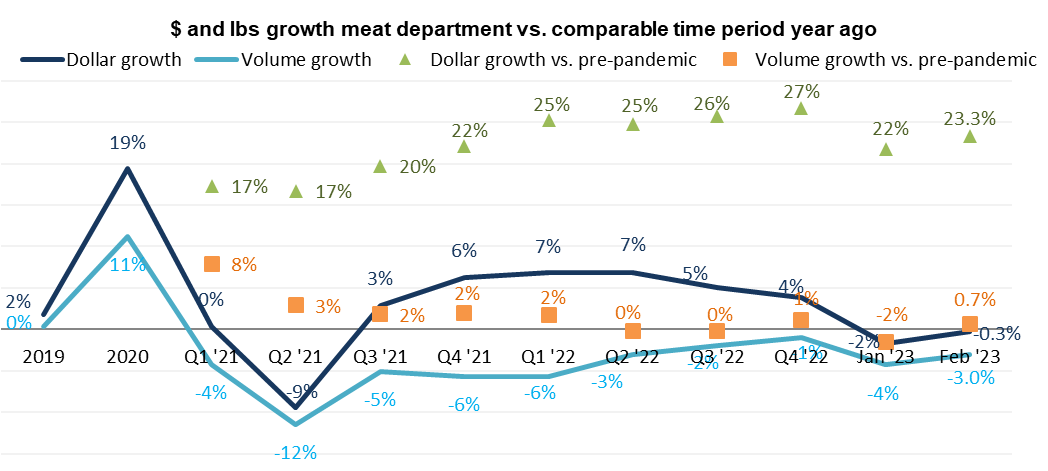
February meat sales improved over their subdued January performance, in particular for fresh meat, that has experienced less inflation than processed meat. Pound sales for fresh meat were down 2.1% year-over-year in February, which combined with mild inflation led to a small dollar increase of 0.3%. Processed meat volume sales dropped 5.3% from their February 2022 levels, which combined with inflation resulted in a year-on-year decrease of 1.5% in dollar sales. In the 52-week view, dollar sales remain ahead of year ago levels, but pounds are trending behind. Compared to the pre-pandemic normal pound sales are still ahead.
After dipping 4% below year ago levels in January 2023, pound sales in February fared better both when compared to February 2022 and February 2020 when sales yet again jumped above pre-pandemic levels. Dollar sales, that had dropped nearly 2% behind year ago levels in January also recovered to come in roughly on par with February 2022 levels.
 Assortment
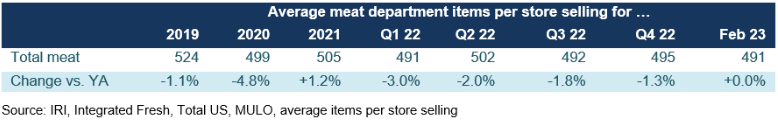
Assortment, measured in the number of weekly items per store is averaging 491 meat and poultry SKUs. For the first time in years, assortment matches that of the prior year even if items are down 4.8% versus February 2020.
Fresh meat by protein
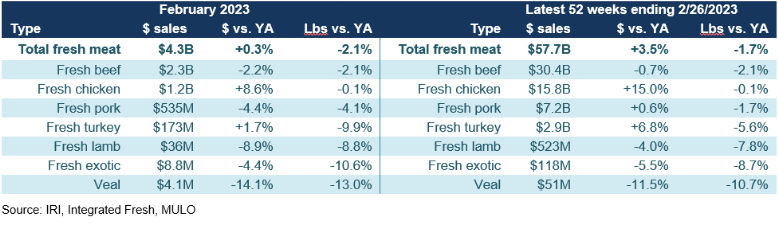
In all, the combination of mild inflation with subdued volume pressure prompted a 0.3% increase in fresh meat sales in February 2023 versus February 2022. Beef was the biggest seller, but chicken had the strongest year-on-year performance. In the 52-week view, dollars trended 3.5% ahead, whereas pounds fell 1.7% behind the year ago levels.
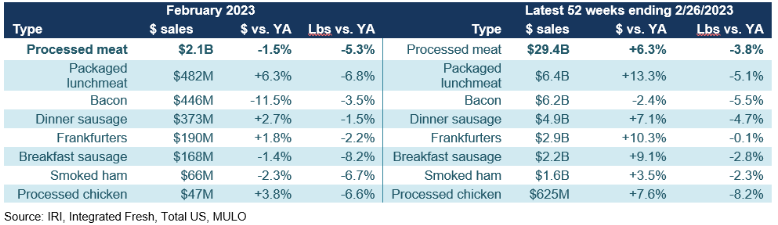
Processed meat
In February, both dollar and pound sales were down when compared to 2022 for total processed meat. Packaged lunchmeat, dinner sausage, Frankfurters and processed chicken grew dollars, but all lost ground in pounds. In the 52-week view, dollar sales did remain ahead of year ago levels, but pound sales trailed by 3.8%. Frankfurters came closest to matching last year’s pound sales, at -0.1%.
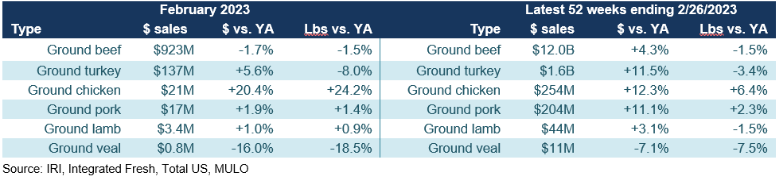
Grinds
Grinds generated $14 billion in the four February weeks, with 84.8% of dollars and pounds being generated by ground beef. The ground beef performance exceeds that of total beef, with pounds down a mere 1.5% from February 2022. Additionally, ground chicken, pork and lamb had positive pound gains as grinds bring affordability and versatility to the meat department. In the 52-week view, grinds totaled $14.2 billion with pound gains for both ground chicken and pork.
What’s next?
The first quarter of 2023 looks to be little different from 2022. Consumers remain worried about inflation and money-saving measures continue to pressure units and volume. While unit sales remain ahead of 2019 for most departments, the year-on-year unit pressure is high. Ingredient inputs, weather and transportation conditions remain areas of concern as prices are lapping the double-digit increases of 2022.
The next performance report in the IRI, 210 Analytics and Hillphoenix series will be released mid-April 2023 to cover the March sales trends.
Please thank the entire meat and poultry industry, from farm to store, for all they do.
Date ranges:
2019: 52 weeks ending 12/28/2019
2020: 52 weeks ending 12/27/2020
2021: 52 weeks ending 12/26/2021
2022: 52 weeks ending 1/1/2023
Q4 2022: 13 weeks ending 1/1/2023
January 2023: 4 weeks ending 1/29/2023
February 2023: 4 weeks ending 2/26/2023
Looking for a reprint of this article?
From high-res PDFs to custom plaques, order your copy today!


