Marketplace pressure drives stronger demand for grinds and chicken
Consumers shift dollars between retail and foodservice as well as between channels, products and brands in an effort to save.
The May marketplace
Summer has arrived and with it the start of grilling season, outdoor entertainment and travel. According to the May Circana survey of 1,000+ primary grocery shoppers, summer travel may look a bit different this year. While 20% of consumers expect they will travel a bit more than in the summer of 2022, inflationary pressures are challenging the travel plans of others. This means fewer/shorter trips and staycations — both opportunities for grocery retailers to create memorable moments at home.
Other findings from the Circana survey include:
- 67% of consumers who like to entertain at home plan cookouts/barbeque gatherings.
- Across entertaining, everyday and weekend occasions, two-thirds of shoppers plan to grill as much as (50%) or more (19%) than last summer. New grills (31%) and the enjoyment of trying new foods and new barbecue recipes (34%) are important drivers behind the growth in grill occasions, according to shoppers. Retailers are increasingly offering grill-ready meat and poultry offerings, in addition to cross-merchandising displays encouraging shoppers to add a few more items in the basket.
- 21% of consumers plan to watch sporting events together with friends this summer — opening the door to sports-focused cross-merchandising opportunities.
- 18% of shoppers plan to organize pool parties, weather permitting.
The May Circana survey of primary grocery shoppers also documented the continued economic pressure on income and its subsequent influence on food spending, with more than eight in 10 shoppers applying one or more money-saving measures. This includes shifting dollars around between retail and foodservice as well as between channels, products and brands. Circana,and 210 Analytics take a deep dive into the numbers to understand the marketplace impact on meat and poultry trends. The May report is made possible by Hillphoenix.
Inflation insights
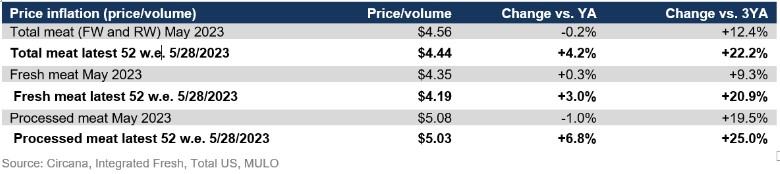
The price per unit across all foods and beverages in the Circana-measured multi-outlet stores, including supermarkets, club, mass, supercenter, drug and military, increased by 6.9% in May (the four weeks ending 5/28/2023), which was down from 11.4% in the first quarter of the year. This means continued moderation of the rate of inflation. However, when compared to the same four-week period in 2020, prices have increased by 23.3%.

The average price per pound in the meat department across all cuts and kinds, both fixed and random weight, stood at $4.56 in May 2023. This means that for the first time in many months, the average price per pound in the meat department was below year-ago levels. This is driven by a decrease in the price per pound for processed meat.
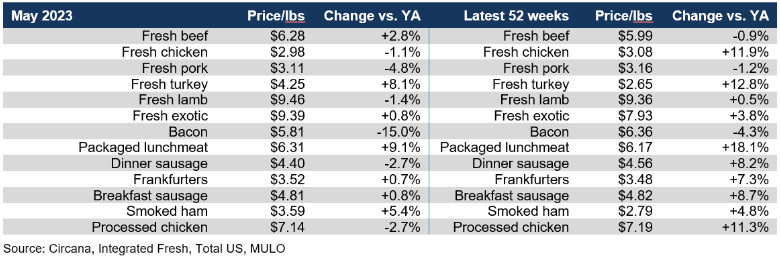
After months of double-digit inflation, chicken price at retail caught up with the decreases seen in wholesale. The average price per pound for chicken in May stood at $2.98, which was down 1.1% versus May of 2022. Most of the big sellers in fresh and processed trended at or below year-ago price per pound levels in May 2023. In the 52-week view, the impact of high inflation could still be seen for chicken, turkey and packaged lunchmeat.
Meat sales
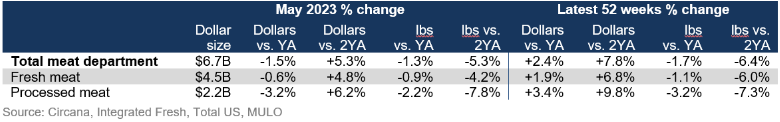
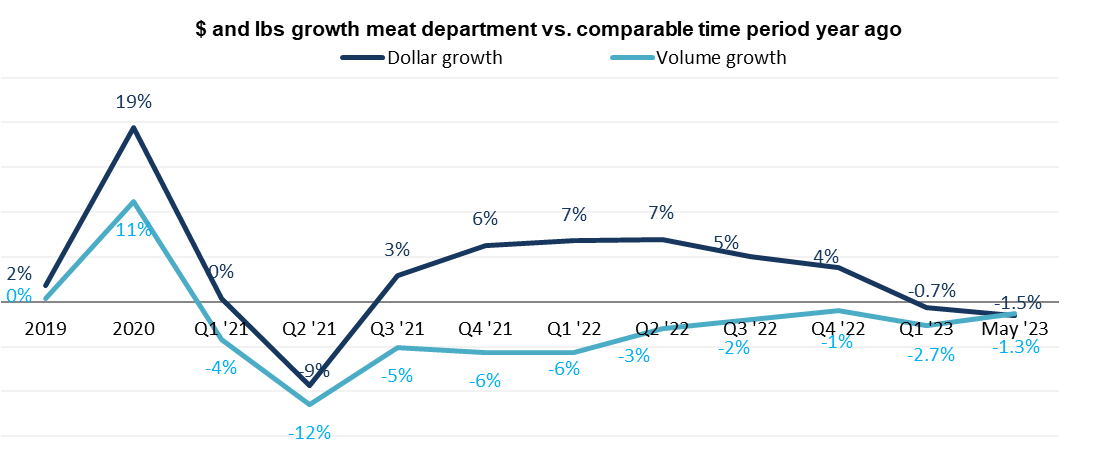
In May 2023, mild deflation combined with a continued pullback on units and volume resulted in meat dollar sales being down 1.5% year-on-year. On an annual basis, meat sales still tracked 2.4% ahead in dollars, but pounds were 1.7% below the 2022 levels.
Volume was trending closer to year ago levels as of the fourth quarter of 2021, but recovery stalled in the fourth quarter of 2022. The pound performance suffered in the first quarter of the year, but once more trended closer to year-ago levels in recent months.
 Assortment
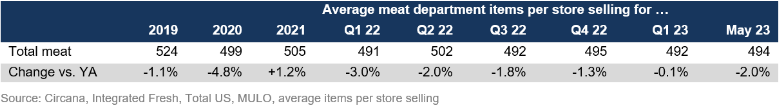
Assortment, measured in the number of weekly items per store averaged 494 meat and poultry SKUs in May 2023. This was down 2.0% versus year ago levels and remains down substantially from the 2019 levels.
Fresh meat sales by protein
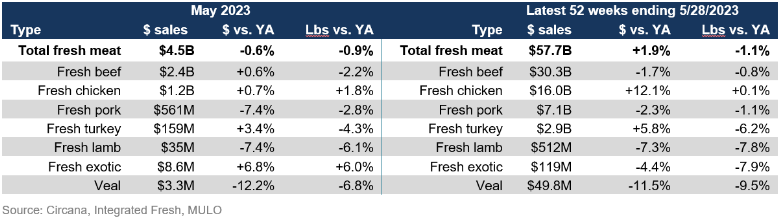
The difference in the year-over-year decrease in pound sales in May 2023 versus the 52-week look was minimal, at -0.9% versus -1.1%, respectively. The difference in the dollar performance therefore lies in the level of inflation, or rather deflation in May 2023. The path for the two biggest sellers, beef and chicken, was very different in May. Whereas beef experienced a 2.2% decrease in pound sales, chicken pound sales increased 1.8%. These are fairly typical recessionary and inflationary patterns. Chicken and fresh exotic (including bison) were the only two areas that increased pound sales in May 2023. Chicken was the only species to accomplish pound growth in the 52-week look.
Processed meat
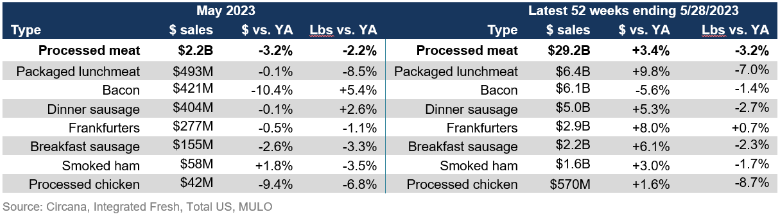
May 2023 processed meat sales were less than half that of fresh meat, at $2.2 billion. Dollar sales were down by 3.2% versus May 2022, while pounds decreased 2.2%. In the 52-week view, dollar sales did stay ahead of year-ago levels by 3.4%, whereas the pound performance was pulled down by package lunchmeat and processed chicken.
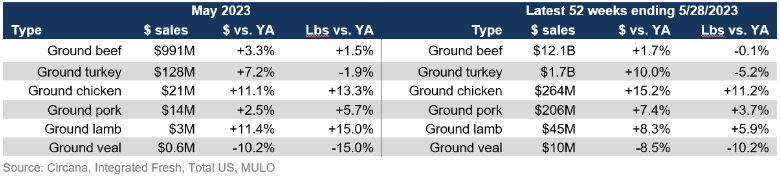
Grinds
In the past year, grinds generated $14.3 billion, with 84.6% of dollars and pounds being generated by ground beef. The ground beef performance exceeds that of total beef, with a year-on-year pound increase of 1.5% in May 2023 when compared to May 2022 sales. Additionally, ground chicken, pork and lamb gained in pounds in May as grinds bring affordability and versatility to the meat department.
What’s next?
The Fourth of July is around the corner and one of the biggest grilling holidays of the year. According to the May Circana survey, 65% of Americans engaged in some kind of special activity last year, led by friends/family get togethers (36%), day and weekend trips (36%) and cookouts (25%). This year’s plans are very similar.
The next performance report in the Circana, 210 Analytics and Hillphoenix series will be released mid-July 2023 to cover the June sales trends.
Please thank the entire meat and poultry industry, from farm to store, for all they do.
Date ranges:
2019: 52 weeks ending 12/28/2019
2020: 52 weeks ending 12/27/2020
2021: 52 weeks ending 12/26/2021
2022: 52 weeks ending 1/1/2023
Q4 2022: 13 weeks ending 1/1/2023
Q1 2023: 13 weeks ending 4/2/2023
March 2023: 5 weeks ending 4/2/2023
April 2023: 4 weeks ending 4/30/2023
May 2023: 4 weeks ending 5/28/2023
Looking for a reprint of this article?
From high-res PDFs to custom plaques, order your copy today!


