Meat case sets strong pace out of the gate for '24
January brought year-on-year deflation for the vast majority of fresh and processed categories.
Photo credit: Fred Wilkinson
In January 2024, beleaguered consumers received some good news with the USDA predicting a slight reduction in grocery prices in 2024. Additionally, the U.N. Food and Agriculture Organization announced that its food price index is at the lowest level in three years. However, rising labor and other operational costs have been eroding margins and the USDA expects restaurant prices to continue their fourth-quarter increase in 2024.
January restaurant engagement was flat, with 80% of consumers having dined at restaurants or ordered takeout or delivery, according to the Circana survey of primary grocery shoppers. The home-cooked share of meals also continued to average around 78% to 80% for most households. When shopping for groceries, the survey found that 81% of consumers applied one or more money-saving measures in January, led by looking for sales promotions (53% of households), cutting back on non-essentials (40%) and looking for coupons (33%).
According to the survey, seven in 10 consumers started the year with one or more New Year’s resolutions. Unsurprisingly, “eating healthier or starting a diet” was easily the number one resolution, at 42% of consumers. Twenty-one percent plan to spend more time with friends and family — an important merchandising and marketing clue for seasonal celebrations and get-togethers.
As of mid-January, 55% of U.S. households planned to watch the Super Bowl, with 36% buying extra snacks for the game beyond the snacks/food typically in the house. One-quarter plan to order takeout, such as pizza, for the game. This is a powerful reminder of the sales opportunity related to the 2024 Olympics, tailgating and more.
Circana and 210 Analytics will continue to track the trends in the meat department throughout 2024 as continues shift their dollars across items, brands, sizes, stores and restaurants. The report is made possible by Hillphoenix.
Inflation insights
The price per unit across all foods and beverages in the Circana-measured multi-outlet stores, including supermarkets, club, mass, supercenter, drug and military, increased by 0.9% in January 2024 (the four weeks ending 1/28/2024) versus January 2023. The perishable departments combined experienced a 0.3% decline in the average price per unit, whereas dry grocery prices increased by 2.0%. Despite price increases slowing down, 93% of consumers in the January Circana shopper survey remained concerned over grocery prices.
The average price per pound in the meat department across all cuts and kinds, both fixed and random weight, stood at $4.55 in January, up 1.2% from year-on-year. Processed meat tends to have the higher prices, but its average price per pound decreased for bacon, packaged lunchmeat, dinner and breakfast sausage, and processed chicken.
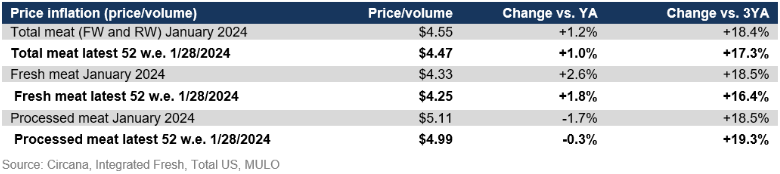
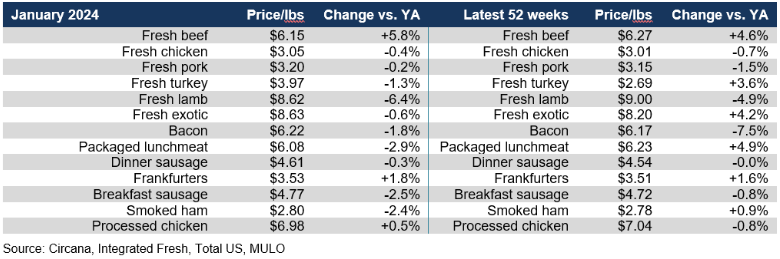
January brought year-on-year deflation for the vast majority of fresh and processed categories. Beef prices reflected a tight market once more.
Meat sales
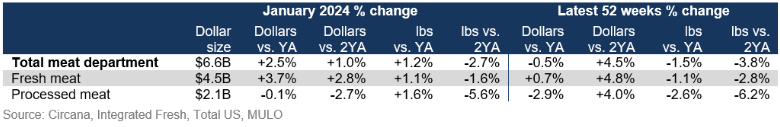
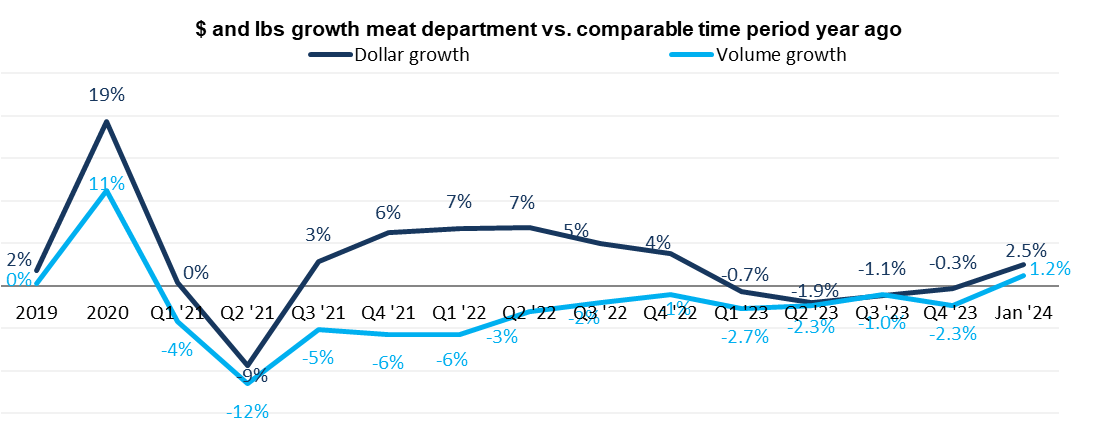
January brought a welcome change for the meat department with an increase in pound and dollar gain in comparison to January 2023. On an annual basis, pounds are getting closer to their prior-year levels as well.
The first week of the year shows the big impact holidays have on meat department sales. With a year-over-year pound gain of 6.2%, dollar sales increased by 6.8% during the week ending January 7th. Both the level of sales and the comparison to year-ago levels deteriorated in the later January weeks.
All throughout 2023 volume has hovered between one and two percent behind year ago levels — making the January performance one of the strongest in many months.
 Assortment
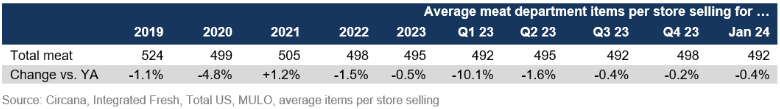
Meat department assortment, measured in the number of weekly items per store, averaged 492 SKUs in January 2024 — holding steady around 30 items below pre-pandemic levels.
Fresh meat sales by protein
Fresh experienced a strong performance in January, with pound gains for beef, chicken, turkey, lamb and fresh exotic (which includes bison). In the full year view, dollars remained in the plus whereas pounds were about 1% behind prior year levels.
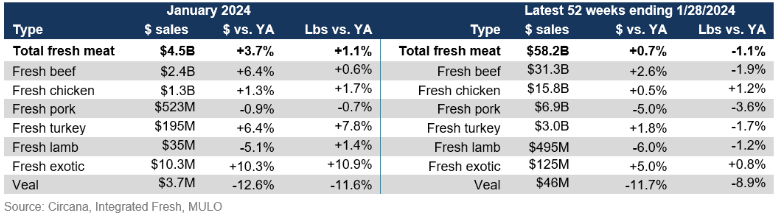
New Year’s included turkey on the menu with a 15.6% increase in turkey pounds during the first week of the month. Pound sales growth continued to be positive during the rest of the month as well.
All subcategories of turkey performed well. Turkey breast in particular had a very strong start of the year, perhaps hand-in-hand with consumers’ New Year’s resolutions.
Processed meat
January processed meat sales were less than half that of fresh meat, at $2.1 billion. Dollar sales were flat when compared to January 2023, while pounds increased 1.6%. This was a far better result than the full-year view that shows declines for both dollars and pounds.
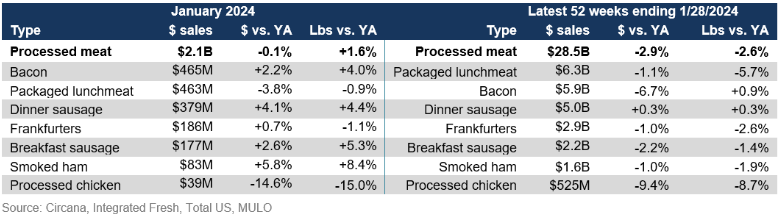
Smoked ham sales also remained a holiday favorite during the first week of January. The week ending Jan. 7 saw a 10.5% increase in pounds and 11.3% in dollars.
Grinds
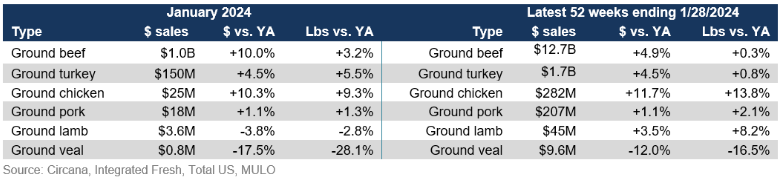
The strong beef performance was driven by ground beef, which had a 3.2% increase in pounds. Smaller grinds, including turkey, pork and chicken, gained in both pounds and dollars in January.
What’s next?
Important touchpoints for February and March include Valentine’s Day, St. Patrick’s Day and an early Easter Sunday on March 31.
- According to National Confectioners Association, 85% of consumers celebrate Valentine’s Day some or all years. This year’s weekday timing is a prime opportunity for retail to capture a larger share of dollars, with cross-department solutions and celebrations.
- The Easter selling season is shorter than it has been in many years. If Thanksgiving, Christmas and New Year’s patterns hold, the sales peak will likely shift back to the holiday week itself instead of the week prior. The party size continues to creep up to an average of 8.2 people, with consumers expecting to spend a little more than last year.
The next performance report in the Circana, 210 Analytics and Hillphoenix series will be released mid-March 2024 to cover the February sales trends.
Date ranges:
2023: 52 weeks ending 12/31/2023
January 2024: 4 weeks ending 1/28/2024
Looking for a reprint of this article?
From high-res PDFs to custom plaques, order your copy today!