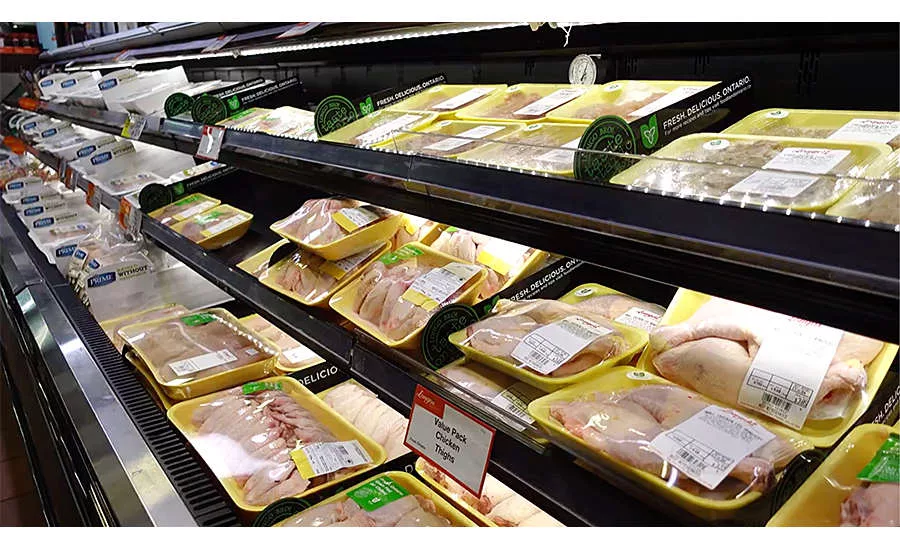
Market pressure drives demand for grinds and chicken
Cookouts, get-togethers, day trips and special meals underscore the opportunity for grocery retailers to deliver on memorable experiences at home.
Special occasions and celebrations are the number one reasons for consumers to splurge a little, according to a May consumer survey by 210 Analytics. The June survey of 1,000-plus primary grocery shoppers by Circana (formerly IRI) confirms just that. Nearly seven in 10 consumers did something special for the July Fourth weekend and more than half have already made special plans for Labor Day. Cookouts, get-togethers, day trips and special meals are central to both summer holidays — underscoring the opportunity for grocery retailers to deliver on memorable experiences at home.
Other findings from the June Circana survey include:
- While the rate of inflation has moderated in the past three months, 86% of consumers still perceive them as much higher (59%) or somewhat higher (27%) when compared to last year.
- The sustained increases in prices of groceries and beyond have 93% of consumers concerned. This level has been extremely high ever since the second quarter of 2022 when inflation moved into the double digits.
- In response, 82% continue to make changes to what, how much, which brand and where they are shopping for groceries. Money-saving measures continue to be focused on capitalizing on sales promotions (51%) and cutting back on non-essentials (45%). One-third also looks for coupons more often.
- Stock-up behaviors are down. Shoppers are much less concerned that items will not be available the next time they shop (12%), making concern over potentially higher prices the number one reason why 44% stock up on essentials when shopping for groceries.
- Outside of in-store signage, the grocery store app has become the number one way in which shoppers research promotions, followed by the printed circular (29%) and emails (27%).
- Sales specials are increasingly driving the meal lineup: 36% check what is on sales before making the shopping list and 27% check deals across more than one retailer.
- Shoppers buying groceries exclusively online has crept up to 6%. This share is boosted by Gen Z/younger Millennials (8%) and older Millennials (10%) versus just 2% of Boomers.
The outside marketplace means continued shifts in how consumers spend their dollars across retail and foodservice. Circana and 210 Analytics take a deep dive into the numbers to understand the marketplace impact on meat and poultry trends. The May report is made possible by Hillphoenix.
Inflation insights
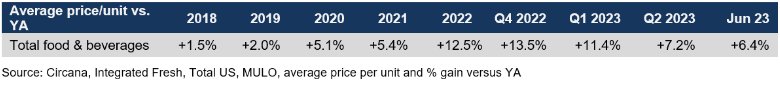
The price per unit across all foods and beverages in the Circana-measured multi-outlet stores, including supermarkets, club, mass, supercenter, drug and military, increased by 6.4% in June (the five weeks ending 7/2/2023). The continued concern among consumers lies in the cumulative effect of inflation. When comparing June 2023 to June 2020, prices have increased by 23.2%. The second quarter averaged a price per unit increase of 7.2%, which was down substantially from 11.4% inflation in the first quarter of the year.
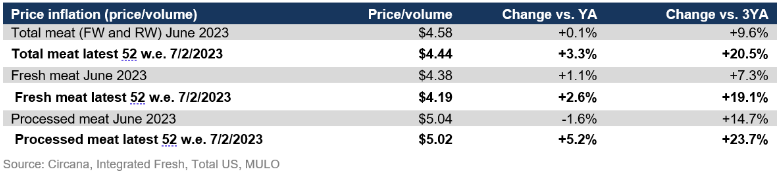
The average price per pound in the meat department across all cuts and kinds, both fixed and random weight, stood at $4.58 in June 2023, which was virtually unchanged from the levels seen in June 2022. Pricing was slightly higher for fresh meat but processed meat prices came down 1.6% from June 2022 levels, primarily driven by bacon.
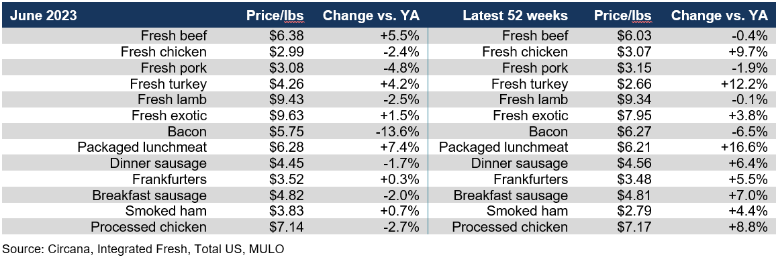
After months of double-digit inflation, chicken price at retail caught up with the decreases seen in wholesale. The average price per pound for chicken in June stood at $2.99, which was down 2.4% versus June of 2022. Turkey prices still increased but not near as much as in prior months. The big difference in June was the average retail price of beef, that increased by 5.5% after several months of deflation. Deflation did persist for bacon and sausage.
Meat sales
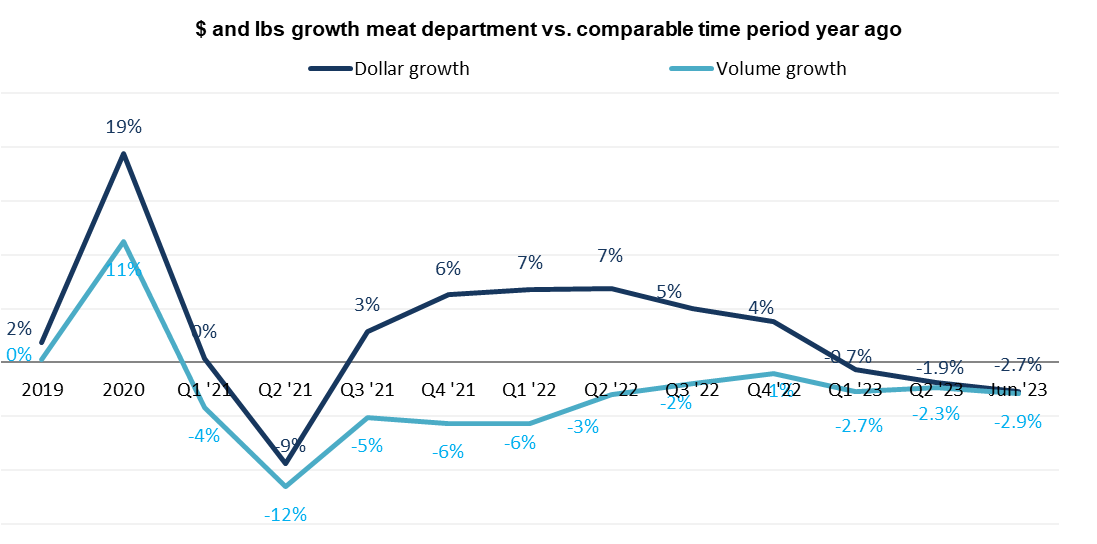
In June 2023, flat prices in combination with fewer units and pound sold than last year resulted in meat dollar sales being down 2.7% year-on-year. On an annual basis, meat sales still tracked 1.6% ahead in dollars, but pounds were 1.7% below the 2022 levels.
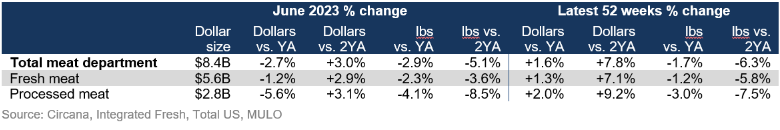
Volume was trending closer to year ago levels until the fourth quarter of 2022, but recovery stalled come 2023 and pounds have been trending between 2% and 3% behind the prior year levels. Because of strong inflationary conditions having turned into deflationary or flat prices, the dollar and volume lines started to trend close together.
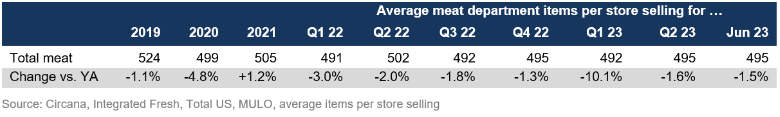
 Assortment
Assortment, measured in the number of weekly items per store averaged 495 meat and poultry SKUs in June 2023. This was down 1.5% compared to the assortment in June 2022.
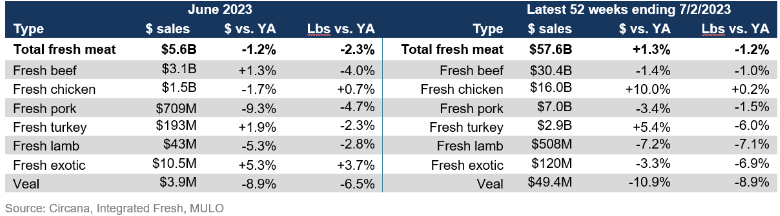
Fresh meat sales by protein
When comparing the year-over-year decrease in pound sales in the June versus full-year view, it appears that that rate of decline is speeding up, at -2.3% versus -1.2%, respectively. The difference in the dollar performance therefore lies in the level of inflation/deflation. The path for the two biggest sellers, beef and chicken, was very different in June. Whereas beef experienced a 4% decrease in pound sales, chicken pound sales increased 0.7%. These are fairly typical recessionary and inflationary patterns. Chicken and fresh exotic (including bison) were the only two areas that increased pound sales in June 2023. Chicken was the only species to accomplish pound growth in the 52-week look.
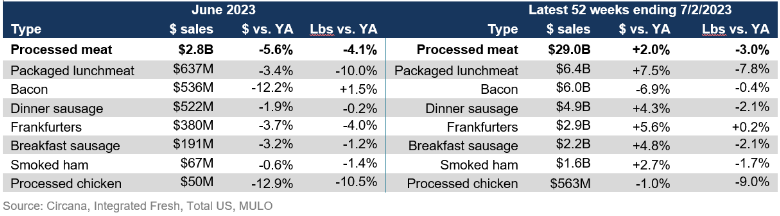
Processed meat
June 2023 processed meat sales were half that of fresh meat, at $2.8 billion. Dollar sales were down by 5.6% versus June 2022, while pounds decreased 4.1%. In the 52-week view, dollar sales did stay ahead of year-ago levels by 2.0%, whereas the pound performance was pulled down by package lunchmeat and processed chicken. Interestingly, the latter has had a stellar performance in the frozen food aisles.
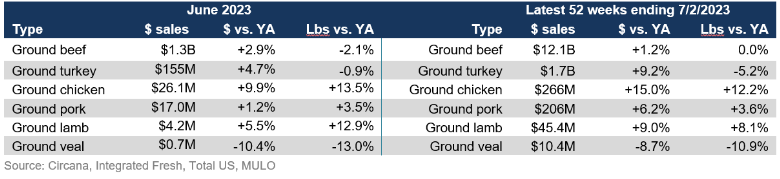
Grinds
In the past year, grinds generated $12.1 billion, with 85% of dollars and pounds being generated by ground beef. The ground beef performance exceeds that of total beef. Additionally, ground chicken, pork and lamb gained in pounds in June as grinds bring affordability and versatility to the meat department.
What’s next?
While the moderating rate of inflation is an encouraging sign, few categories have seen a commensurate strengthening in demand. For many consumers, the duration and depth of inflation have exceeded any improvements in personal income over the past few years. This is underscored by record credit card debt levels and very low savings rates. When comparing their current financial situation to that of a year ago, the June Circana survey found that 37% of consumers say they are worse off, versus 17% who are doing financially better. When looking ahead to next year, the survey found that 26% believe their financial situation will look better versus 28% who believe it will deteriorate further. While these percentages virtually balance out, it means that few people will be spending with confidence. This will likely mean a continued home-centric world for a while to come. This tends to benefit grocery retailing, however, the level of money-saving measures counterbalances the greater share of meal allocations.
The next performance report in the Circana, 210 Analytics and Hillphoenix series will be released mid-August 2023 to cover the July sales trends. Please thank the entire meat and poultry industry, from farm to store, for all they do.
Date ranges:
Q2 2023: 13 weeks ending 7/2/2023
June 2023: 5 weeks ending 7/2/2023
Looking for a reprint of this article?
From high-res PDFs to custom plaques, order your copy today!


