State of the Industry
State of chicken: Consumption at all-time high
Chicken tops the list of protein being consumed most often per week.
People are buying more chicken than last year and plan to buy more next year.
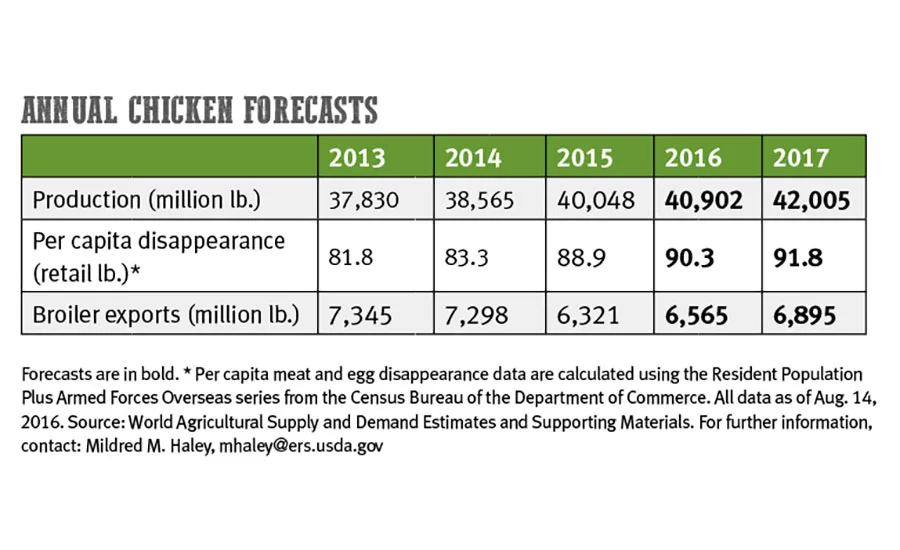
U.S. chicken consumption remains high, with 2016 levels surpassing those from the previous two years, according to U.S. Department of Agriculture (USDA) data and to research presented this summer at the National Chicken Council’s 2016 Chicken Marketing Summit.
In the two weeks leading up to the survey, 87 percent of consumers ate a chicken meal or snack purchased from a supermarket, and 72 percent ate a chicken meal or snack from a foodservice establishment. While supermarket numbers increased 2.4 percent and are now at parity with those seen in 2015, foodservice establishment consumption shows a noteworthy 7.5 percent increase from 2015.
The survey was commissioned by the National Chicken Council and conducted online by ORC International June 6-9, 2016, among 1,017 adults. Funding was provided by Elanco and WATT Global Media. A full copy is available by visiting
www.nationalchickencouncil.org.
Consumers’ taste for chicken shows no signs of waning, either. In the next 12 months, 21 percent of consumers anticipate eating more chicken from the supermarket and 14 percent anticipate eating more from a foodservice establishment. In fact, according to the USDA, Americans will eat nearly 92 pounds of chicken per person this year — a record amount.
People are buying more chicken than last year and plan to buy more next year. Chicken tops the list of protein being consumed most often per week. And while retail sales continue to be strong, the survey shows more people are eating chicken away from home, which is good news for chicken producers, foodservice establishments and the overall economy.
There is some freed-up cash helping American consumers make more of these meat and poultry purchases, too. Compared with last year, the average American city shopper is paying about 5 percent less for boneless chicken breasts, according to the most recent Average Retail Food and Energy Prices report put out by the Bureau of Labor Statistics. Dark meat also remains a value.
Couple that with an average 20 percent year-over-year drop in gasoline prices in July, and the daily expenses of most Americans have declined considerably, freeing some money to make other purchases in the economy, including food and dining out. The U.S. Census Bureau released a report on Sept. 13 showing median household income surged 5.2 percent in 2015 to $56,500, the highest since 2007, in large part due to employment gains. More than a few studies have documented that more than 90 percent of chicken consumption can be explained by the price of chicken and the health of the economy.
The NCC survey continued by asking consumers to rank various factors on satisfaction and in order of importance. Regardless of purchase channel, freshness, taste and price rise to the top for both measures. Across the board, consumers are satisfied with freshness and taste. Satisfaction with price differs by channel with foodservice establishments experiencing moderate satisfaction levels while satisfaction with price at supermarkets is somewhat lower.
Consumers with the highest consumption levels tend to skew younger, more affluent and ethnically diverse with larger households. Among gender, total chicken consumption was split right down the middle: 50 percent female; 50 percent male.
When it comes to sources of information, conventional sources such as the government, grocery stores, farmers/growers, butchers and brands are preferred. The appeal of sources such as blogs and celebrities are more limited.
Trust is also a point of differentiation. Supermarkets garner reasonable levels of trust and, along with brands, comprise the second tier of desired sources of information behind the government.
Consumers were asked if various claims would increase, decrease or have no impact on their likelihood to purchase their favorite chicken products. Overall, when asked to choose among various claims, consumers are most interested in knowing that no antibiotics were used in production of their food.
When prompted, 71 percent of consumers were extremely or very concerned about food safety, and 57 percent about hormone and steroid use, even though they are banned by federal law. Only 19 percent of respondents were extremely or very concerned about the time it takes to raise a chicken.
Expanding on transparency
But we know that with popularity, variety and so many choices come questions, confusion and sometimes misperceptions. Separate research from NCC found that: 78 percent of people mistakenly believe chickens are genetically modified; 77 percent believe chicken contains added hormones or steroids, which are banned by federal law; nearly three-quarters (73 percent) think antibiotics are present in chicken meat; and 68 percent wrongly believe chickens raised for meat are raised in cages.
We know too that questions about animal welfare are top of mind as people want to know more than just that the food they purchase is safe for them — they want to know it was raised humanely and sustainably.
Chicken farmers and company personnel take pride in the care of their chickens, and the fact is that our national flock is as healthy as it has ever been, but we know it’s on us as an industry to do a better job of providing more information on how our food gets from farm to table, and to do a better job of providing our customers the resources they need to give consumers the level of information they seek.
What does organic chicken really mean? Are the chickens given hormones? Why are the chicken breasts so big? Is your chicken from China?
In an effort to recognize and respond to questions, NCC launched Chicken Check In (www.ChickenCheck.In), which provides real answers about chicken production and offers people a close look at the lives of the birds and how they get to the store.
From videos to FAQs to infographics, Chicken Check In is a resource to use when talking chicken. The site contains a chicken labeling glossary, information on food safety and Salmonella, “woody breast” and many other topics.
We’re committed to continuing to build consumer trust by having open conversations and inviting people to ask the questions they have about chicken and how it’s produced. NP
State of the Industry 2016 segments
| Industry overview | Goes live Oct. 14 |
| Beef (CAB) | Oct. 18 |
| Beef (NCBA) | Oct. 19 |
| Pork (Pork Board) | Oct. 20 |
| Pork (Sun Trust) | Oct. 21 |
| Chicken | Oct. 24 |
| Turkey | Oct. 25 |
| Veal | Oct. 26 |
| Lamb | Oct. 27 |
| Food Safety | Oct. 28 |
| Packaging | Oct. 31 |
Looking for a reprint of this article?
From high-res PDFs to custom plaques, order your copy today!


