Value-added meat holds its own with pandemic gains of 29.2%
The meat department has ruled the fresh perimeter since the onset of the pandemic. With 62% of the year behind us, meat department sales have already surpassed more than 77% of 2019 sales. Everyday demand continued to carry fresh and processed meat sales well above prior year levels for the week ending August 16. This was the sixth of eight non-holiday weeks between Independence Day and Labor Day. New COVID-19 cases started to moderate in many states and the federal unemployment benefit that expired at the end of July was extended, albeit a lower amount than previously.
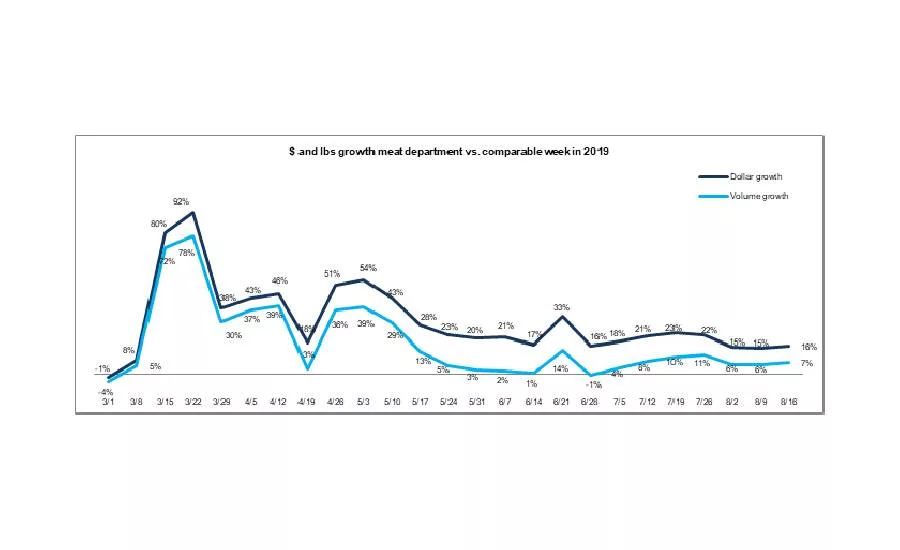
The net result of all the positive and negative forces for the meat department was double-digit dollar gains, at +16.1% during the week ending August 16 versus the comparable week year ago. This was up slightly from the prior two weeks and the 23rd week of double-digit dollar gains. Volume increased 6.7% the week of August 16 versus year ago — also up slightly from 5.9% the week prior. At an average of $3.85 per volume across all meats during the week of August 16, prices were flat against the prior week’s $3.84 per pound.
So far during the pandemic, starting March 15 through August 16, dollar sales are up 32.3% and volume sales have increased 19.6% versus the same period last year. This translates into an additional $8.5 billion in meat department sales during the pandemic, which includes an additional $3.9 billion for beef, $1.2 billion for chicken and $881 million for pork. Unit sales continue to do well, with 14.8 million more transactions during the week of August 16 compared with same week year ago and 882 million more meat packages sold for the department since the pandemic began.
Dollar versus Volume Gains
While inching up a bit, the volume/dollar gap for total meat, total fresh and total processed remained in single digits. At its widest point, the growth gap between volume and dollar gains was 19.1 percentage points during the week of June 21st. Processed meats had a very strong performance this week, up 19.0% — nearly four points higher than fresh meat. Volume gains were much stronger as well.
| Latest 1 week ending August 16, 2020 versus comparable week in 2019 | Dollar gains | Volume gains |
Volume/dollar gap (percentage points) |
| Total meat | +16.1% | +6.7% | -9.4 |
| Total fresh | +15.2% | +5.9% | -9.3 |
| Total processed | +19.0% | +9.6% | -9.4 |
Source: IRI, Total US, MULO, 1 week % gain versus YA
For the first time since the onset of coronavirus, the volume/dollar gap in the longer, four-week look dropped below the 10-point mark. For the four weeks ending August 16, the gap narrowed from 10.8 percentage points to 9.7 points — signaling average retail prices continued to come down. The longer view shows double digit gaps for beef and lamb, but pork has narrowed to just 2.8 points and turkey to 2.8 points. Fresh exotic meats, including bison, is the only area that saw volume gains trending ahead of dollars, creating a positive gap, at +4.3 points. In the one-week look, all meats now have single digit gaps, with the exception of lamb and frankfurters.
| Latest 4 weeks ending August 16, 2020 versus comparable weeks in 2019 | 4-week dollar gains | 4-week volume gains | 4 week volume/dollar gap (points) | 1 week volume/dollar gap (points) |
| Total meat | +17.3% | +7.6% | -9.7 | -9.4 |
| Fresh beef | +22.0% | +10.3% | -11.7 | -10.9 |
| Ground beef | +13.4% | +3.3% | -10.1 | -9.0 |
| Fresh chicken | +9.3% | +2.2% | -7.1 | -6.6 |
| Fresh pork | +13.8% | +11.0% | -2.8 | -4.0 |
| Fresh turkey | +12.4% | +9.8% | -2.6 | -2.8 |
| Fresh lamb | +30.6% | +19.1% | -11.5 | -11.4 |
| Fresh exotic | +32.4% | +36.7% | +4.3 | +4.3 |
| Fresh veal | +13.0% | +11.8% | -1.2 | +2.4 |
| Smoked ham/pork | +19.1% | +14.9% | -4.2 | -8.0 |
| Sausage | +17.4% | +10.6% | -6.8 | -6.8 |
| Frankfurters | +15.7% | +0.5% | -15.2 | -15.3 |
| Bacon | +18.5% | +10.9% | -7.6 | -8.0 |
Source: IRI, Total US, MULO, 4 weeks ending August 16, 2020 versus YA
Assortment
The slow and steady comeback in the number of items continued. For the week of August 16, the average number of items per store was 323, which was down about 14 items from prior year levels — a vast improvement from May and June levels.
| Average weekly items per store selling for week ending… | ||||||
| March (3/1-3/29) | April (4/5-4/26) | May (5/3-5/31) | June (6/7-6/28) | July (7/5-7/26) | 8/9 | 8/16 |
| 332 | 315 | 301 | 304 | 317 | 323 | 324 |
Source: IRI, Total US, MULO, average weekly items per store selling
Price
IRI insights on the price per volume shows prices were still elevated mid August versus 2019 levels. The year-over-year comparison shows that pork and turkey prices were closest to 2019 levels. Surpassing beef, lamb prices were the most elevated versus year ago, at +10.5%. In the longer four-week look, beef’s year-over-year prices dropped to single digits, including ground beef prices.
|
Average price per volume versus the same period year ago |
1 week ending August 16 | 4 weeks ending August 16 | |||
| Average | Change vs. prior period |
Change vs. YA |
Average | Change vs. year ago | |
| Total meat (fresh + processed) | $3.85 | +0.5% | +8.8% | $3.87 | +8.3% |
| Fresh beef | $5.40 | +0.3% | +10.1% | $5.50 | +9.6% |
| Ground beef | $4.09 | -0.8% | +8.9% | $4.18 | +8.9% |
| Fresh chicken | $2.47 | +0.1% | +6.4% | $2.47 | +6.5% |
| Fresh pork | $2.86 | +3.0% | +3.8% | $2.79 | +2.5% |
| Fresh turkey | $3.43 | +5.3% | +2.5% | $3.38 | +2.2% |
| Fresh lamb | $8.56 | +1.6% | +10.5% | $8.57 | +8.8% |
| Fresh exotic | $4.27 | +0.2% | -3.1% | $4.23 | -3.2% |
Source: IRI, Total US, MULO, 1 week and 4 weeks ending August 16, 2020
Value-Added Meats Experience Big Boost Amid the Pandemic
Value-added meat has been a growth driver for several years, based on the combination of a higher consumption frequency and an increase in household penetration. Demographically and behaviorally, core users skew toward younger shoppers in urban areas, with both a high level of weekly spending and number of trips. This exact shopper group is already in, or entering into, their prime spending years. Therefore, value-added meat and poultry have been a growth driver for the department, with the overall value-added share increasing to 9.5% in the 52 weeks ending right before the start of the pandemic purchasing. As pandemic shopping patterns started to unfold, many retailers had limited ability to create value-added items in-house, due to a lack of available labor hours. However, case-ready value-added items did very well. In all, value-added meat sales increased 29.2% between March 15 and July 12 versus the same period year ago. Given the enormous conventional sales, value-added shares dropped slightly, with the exception of turkey. With more consumers indicating they are struggling with weekly meal planning and coming up with new recipes, value-added meats will likely continue to see strong sales in weeks to come.
| Value-added meat and poultry |
Share of total meat/protein |
52-week $ growth w.e. 2/23/20 |
Pandemic share of total meat/protein |
Pandemic $ growth w.e. 3/15-7/12 vs. YAGO |
| Total | 9.5% | +2.4% | 9.0% | +29.2% |
| Beef | 8.9% | +2.9% | 8.6% | +33.5% |
| Chicken | 8.0% | -0.5% | 7.5% | +12.6% |
| Pork | 16.1% | +6.3% | 14.4% | +34.4% |
| Turkey | 10.4% | -4.8% | 12.5% | +38.6% |
Source: IRI, U.S. MULO, fixed and random weight
Meat Gains by Protein
Pork became the protein with the lowest year-over-year growth, at +8.9% this week. This ends a three-month streak of chicken gains being the lowest. Chicken sales were much stronger than the past few weeks, at +9.6%.
The Pandemic Sales Performance by Area
Meat department sales were $1.3 billion during the week of August 16 — about $32 million lower than the week prior. In other words, sales over the prior periods were off 2.4%, even if year-over-year sales were a little higher than they were the week of August 9. Exotic meat, including bison, had the strongest gains, at +32.7%. Beef accounted for 49.9% of the $180 million in new meat department dollars this week, punching above its weight with a sales share of 42.3%. At +$89.7 million, beef’s additional dollars were more than four times that of chicken the week of August 16, that generated +$21.8 million. Pork added the third most new dollars this week, at +$10.0 million.
| 2020 Weekly $ sales gains versus comparable 2019 week ending… | $ | |||||||||||
| 3/1 |
March (3/8-3/29) |
April (4/5-4/26) |
May (5/3-5/31) | June (6/7-6/28) | July (7/5-7/26) | 8/9 | 8/16 | 8/16 | ||||
| TOTAL MEAT | -1% | +54% | +38% | +32% | +22% | +21% | +14.8% | +16.1% | $1.30B | |||
| Fresh | ||||||||||||
| Beef | 0% | +53% | +42% | +36% | +27% | +28% | +20.6% | +19.5% | $549M | |||
| Chicken | +1% | +41% | +32% | +21% | +13% | +12% | +4.0% | +9.6% | $205M | |||
| Pork | -5% | +56% | +44% | +32% | +24% | +21% | +12.4% | +8.9% | $123M | |||
| Turkey | 0% | +72% | +36% | +43% | +23% | +17% | +12.5% | +11.2% | $38M | |||
| Lamb | +1% | +34% | +8% | +36% | +39% | +39% | +24.3% | +19.8% | $8M | |||
| Exotic | +5% | +92% | +54% | +61% | +48% | +36% | +29.5% | +32.7% | $3M | |||
| Processed | ||||||||||||
| Smoked ham/pork | -6% | +118% | +20% | +63% | +35% | +26% | +19.2% | +15.8% | $16M | |||
| Sausage | 0% | +63% | +42% | +35% | +24% | +17% | +15.3% | +18.5% | $124M | |||
| Frankfurters | -1% | +76% | +39% | +20% | +17% | +14% | +13.0% | +19.1% | $58M | |||
| Bacon | -6% | +54% | +48% | +34% | +18% | +19% | +15.4% | +19.6% | $118M | |||
Source: IRI, Total US, MULO, 1 week % change vs. YA
Grinds
Sales for grinds backslid slightly, with both ground beef and ground turkey in single digit growth for dollars and volume. Ground beef increased 10.0% in dollars and volume remained in positive territory, at +1.0%
- Ground turkey, +8.3% in dollars and +6.0% in volume
- Ground chicken, +19.4% in dollars and +20.7% in volume
- Ground pork, +13.5% in dollars and +10.0% in volume
Combined, these four ground proteins generated $237 million in sales, down from $243 million the week prior. Ground beef represented 86.7% of additional $215 million in year-over-year dollars.
Market Shifts
The pandemic market share trends remained unchanged in mid August. Beef has been an astounding pandemic powerhouse with higher dollar and volume shares. Pork had significantly higher shares a few months ago, but is mostly back in line with prior levels for both dollars and volume. Chicken and turkey remained down in both dollar and volume share. Exotic meats, which includes bison, had a slight volume gain.
| Share of dollar sales | Share of volume sales | |||||
| Week ending 3/1 | Week ending 8/16 | Building calendar year 2019 | Building calendar year 2020 |
Week ending 3/1 |
Week ending 8/16 |
|
| Beef | 53.3% | 56.5% | 54.2% | 55.6% | 37.0% | 39.4% |
| Chicken | 27.5% | 25.6% | 26.8% | 25.4% | 40.5% | 39.0% |
| Pork | 12.9% | 12.7% | 13.5% | 13.6% | 16.5% | 16.7% |
| Turkey | 4.4% | 3.9% | 4.2% | 4.2% | 4.8% | 4.2% |
| Lamb | 0.9% | 0.9% | 0.9% | 0.9% | 0.4% | 0.4% |
| Veal | 0.1% | 0.1% | 0.1% | 0.1% | 0.1% | <0.1% |
| Exotic | 0.3% | 0.3% | 0.3% | 0.3% | 0.2% | 0.3% |
Source: IRI, Total US, MULO, % of total meat department dollars | “All other” not reflected
What’s Next?
Both consumer concern and economic pressure remain high, but seem stable for the moment. The economic pressure typically expresses itself in a greater search for value, whether promotions, private brands, cheaper kinds or cheaper cuts. Back-to-school season is in full swing, though it looks very differently from prior years in most states. This will continue to impact year-over-year trend lines, particularly for meats affected by breakfast and lunch occasions with many more children at home participating in virtual education.
Between the continued social distancing mandates, highly elevated consumer concern about the virus, economic pressure and the impact of virtual schooling, meat sales are likely to hold well above 2019 levels for the foreseeable future.
Source: 210 Analytics/IRI
Looking for a reprint of this article?
From high-res PDFs to custom plaques, order your copy today!


