Meat department closes out 2020 18.4% above 2019 levels
November and December sales were dominated by the holidays along with consumers’ shopping changes in response to the rapidly rising number of new COVID-19 cases across many states. Some states and cities enacted renewed shelter-in-place mandates. This resulted in consumers’ trip frequency falling below last year’s levels, much like it had in early April. Likewise, e-commerce transactions made a return to spring levels. Holiday celebrations were vastly different for Thanksgiving and the December holidays alike. There was less travel, smaller gatherings and many consumers shopped much earlier or online to avoid holiday crowds. But, unlike the spring when similar conditions drove grocery sales double digits above year ago levels, December grocery spending was the most subdued it has been since the onset of the pandemic. December sales for all food-and-beverage-related items (total edibles) increased 8.1% versus 2019 levels, which was down from +9.7% in November and +8.5% in October.
The December sales growth was strong in all the weeks leading up to Christmas. December meat department sales increased 12.9%, excluding online-only and delivery e-commerce sales that would have been significantly higher than in 2019. In some cases, retailers encouraged online shopping to manage traffic flow during one of the busiest shopping weeks of the year. Some provided free delivery, ramped up their curbside order slots and encouraged earlier shopping. Yet, multi-outlet sales the week ending December 27 had the highest gains, at 19.2% above year ago levels, reflecting an additional $275 million in addition meat department dollars.
|
Meat department |
Dollar sales |
Dollar gains |
Absolute dollar gains |
|
Week ending 12/6 |
$1.4B |
+12.6% |
+$156M |
|
Week ending 12/13 |
$1.5B |
+14.7% |
+$197M |
|
Week ending 12/20 |
$1.8B |
+6.1% |
+$101M |
|
Week ending 12/27 |
$1.7B |
+19.2% |
+$275M |
|
Four total December weeks |
$6.4B |
+12.9% |
+$729M |
Source: IRI, Integrated Fresh, Total US, MULO
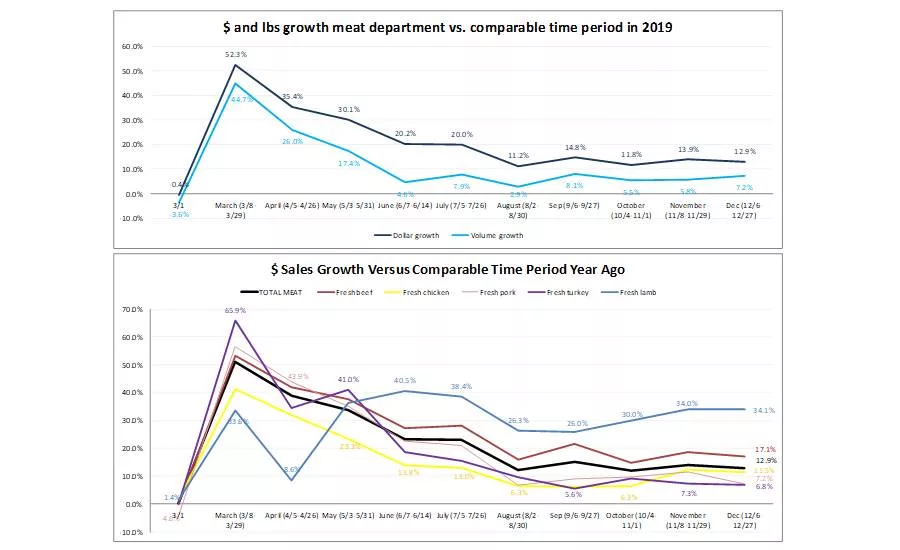
The meat department dollar sales gain of 12.9% is very similar to the sales increases measured since August. As such, patterns seen in the second half of the year are more indicative of the first quarter demand in 2021 than the total 2020 growth. The 7.2% increase in meat department volume over year ago levels is higher than we’ve seen since August. Dollars and volume trended 5.7 points apart — significantly closer than earlier in the year.
Year-in-Review
In 2020, overall meat dollar sales increased 18.4% and volume sales grew 10.3% versus the same period last year. This translates into an additional $12.7 billion in meat department sales during the pandemic, which includes an astounding additional $5.7 billion for beef, $1.6 billion for chicken and $1.1 billion for pork than during the same period in 2019.
|
2020 |
Dollar sales |
Dollar gains |
Absolute dollar gains |
Volume gains |
|
Total meat (fresh + processed) |
$82.0B |
+18.4% |
$12.7B |
+10.3% |
|
Total fresh meat |
$55.0B |
+19.8% |
$9.1B |
+10.3% |
|
Total processed meat |
$27.0B |
+15.7% |
$3.7B |
+10.1% |
|
Fresh beef |
$30.2B |
+23.1% |
$5.7B |
+12.0% |
|
Fresh chicken |
$13.4B |
+13.9% |
$1.6B |
+9.1% |
|
Fresh pork |
$7.2B |
+18.1% |
$1.1B |
+10.8% |
|
Fresh turkey |
$2.7B |
+15.4% |
$367M |
+7.5% |
|
Fresh lamb |
$489M |
+24.3% |
$96M |
+17.4% |
Source: IRI, Integrated Fresh, MULO, % growth versus year ago, 52 w.e. 12/27/2020 versus YA
Dollar versus Volume Gains
Fresh meat had higher gains in both dollars and volume during the month of December on a larger base. The gap between dollar gains and volume gains decreased from 8.1 points in November to 5.7 points in December for the meat department as a whole.
|
% sales change (December 12/6-12/27) versus year ago |
Dollar gains |
Volume gains |
Volume/dollar gap |
|
Total meat |
+12.9% |
+7.2% |
-5.7 |
|
Total fresh |
+14.1% |
+8.5% |
-5.6 |
|
Total processed |
+10.6% |
+4.8% |
-5.8 |
Source: IRI, Integrated Fresh, Total US, MULO, % gain versus YA
Price per Volume
The month-to-month IRI insights on the price per pound volume, show that November was an anomaly in terms of the total meat department price that was pulled down by turkey. In November, prices are much more in line with the trend line that had started to develop in the second half of the year with prices moderating a bit each month in favor of the consumer. The average price per volume for turkey rebounded somewhat in December, to $1.99 per pound. This is still far below the typical levels but 75 cents more than it was in November.
|
Average price per volume and change |
|||||||||||
|
|
Mar |
Apr |
May |
Jun |
Jul |
Aug |
Sep |
Oct |
Nov |
Dec |
|
|
Total meat |
$3.81 |
$3.75 |
$4.02 |
$4.22 |
$4.06 |
$3.96 |
$3.87 |
$3.85 |
$3.08 |
$3.67 |
+5.3% |
|
Total fresh meat |
$3.65 |
$3.71 |
$3.93 |
$4.14 |
$3.92 |
$3.77 |
$3.67 |
$3.64 |
$2.77 |
$3.64 |
+5.2% |
|
Total processed meat |
$4.19 |
$3.83 |
$4.24 |
$4.41 |
$4.39 |
$4.40 |
$4.35 |
$4.37 |
$3.95 |
$3.73 |
+5.5% |
|
Fresh beef |
$5.02 |
$5.32 |
$5.86 |
$6.42 |
$5.68 |
$5.42 |
$5.17 |
$5.14 |
$5.19 |
$5.36 |
+4.1% |
|
Fresh chicken |
$2.43 |
$2.44 |
$2.44 |
$2.48 |
$2.50 |
$2.46 |
$2.41 |
$2.42 |
$2.44 |
$2.42 |
+3.7% |
|
Fresh pork |
$2.87 |
$2.89 |
$3.04 |
$3.14 |
$2.90 |
$2.78 |
$2.73 |
$2.74 |
$2.74 |
$2.65 |
+3.5% |
|
Fresh turkey |
$3.15 |
$3.03 |
$3.37 |
$3.41 |
$3.44 |
$3.43 |
$3.43 |
$3.18 |
$1.24 |
$1.99 |
+2.9% |
|
Fresh lamb |
$8.28 |
$7.98 |
$8.35 |
$8.49 |
$8.52 |
$8.54 |
$8.48 |
$8.51 |
$8.37 |
$8.10 |
+3.5% |
Source: IRI, Integrated Fresh, Total US, MULO, price per volume and % gain versus YA
During September 2020, 35.5% of all meat volume was sold on some type of promotion, whether a circular feature, display, temporary price reduction or any combination thereof. This percentage increased to 36.2% in November but came down a bit in December. December 2020 merchandising levels were about 4 points lower than the year prior. Processed meat is selling more on promotion than fresh meat. In December 2020, 39.4% of all processed meat volume was sold on promotion versus 32.9% for fresh. For smoked ham, nearly 65% of all volume in December 2020 was sold on merchandising. Fresh turkey was very aggressive in promotions in November, but only somewhat elevated from October levels come December.
Assortment
Assortment has nearly completed its comeback after dropping by more than 65 items during some of the tightest supply weeks in May and June. During the month of December, retailers typically increase the number of items to accommodate for holiday choices. While the average number of items per store increased to 539 from September and October levels, assortment remained down 4.7% versus year ago levels although not all new item codes may be tallied just yet.
|
Average items per store selling for week ending… |
|||||||||
|
March |
April |
May |
June |
July |
August |
September |
October |
November |
December |
|
560.2 |
532.1 |
512.4 |
508.2 |
518.4 |
523.2 |
527.0 |
529.0 |
544.4 |
538.8 |
|
-1.1% |
-6.4% |
-10.0% |
-10.7% |
-8.4% |
-6.7% |
-5.8% |
-5.7% |
-5.7% |
-4.7% |
Source: IRI, Integrated Fresh, Total US, MULO, average items per store selling
Meat Gains by Protein
Gains by protein were very stable in the back half of the year. Lamb continued to have the highest percentage gains on its small base, at +34.1% versus the same month year ago. Lamb has kept their monthly gains very steady at 30-40% over year ago. With restaurants in many states closing back down in terms of on-premise dining, it is likely that more lamb sales will continue to flow through retail in the first part of 2021. Beef’s performance continued to be astounding, up 17.1% during December. Various high-end cuts had strong sales, perhaps a reflection of different holiday choices amid smaller gatherings. Chicken saw the smallest gains during the months of May through October, but had a strong December, at +11.5%.
Processed meats had a very strong month as well. Bacon and hot dogs led in percentage growth. This is quite an accomplishment for bacon as the largest of the processed meats at $509 million in December sales.
|
|
2020 $ sales gains versus comparable 2019 period |
|||||||||||
|
|
w.e. 3/1 |
Mar |
Apr |
May |
Jun |
Jul |
Aug |
Sep |
Oct |
Nov |
Dec |
|
|
TOTAL meat |
-0.4% |
+52% |
+35% |
+30% |
+20% |
+20% |
+11% |
+15% |
+12% |
+14% |
+12.9% |
$6.4B |
|
Processed meat |
-1.8% |
+55% |
+29% |
+23% |
+14% |
+14% |
+9% |
+14% |
+12% |
+13% |
+10.6% |
$2.2B |
|
Bacon |
-6.4% |
+53% |
+47% |
+34% |
+18% |
+19% |
+15% |
+19% |
+18% |
+19% |
+17.1% |
$509M |
|
Packaged lunchmeat |
-4.3% |
+48% |
+20% |
+9% |
+6% |
+5% |
+3% |
+6% |
+7% |
+9% |
+9.7% |
$391M |
|
Dinner sausage |
2.7% |
+67% |
+41% |
+34% |
+20% |
+16% |
+11% |
+18% |
+12% |
+14% |
+10.2% |
$329M |
|
Smoked ham |
-5.3% |
+122% |
+20% |
+67% |
+32% |
+26% |
+14% |
+10% |
+4% |
+5% |
+1.0% |
$322M |
|
Breakfast sausage |
-4.4% |
+56% |
+43% |
+40% |
+23% |
+20% |
+18% |
+23% |
+15% |
+12% |
+11.7% |
$192M |
|
Frankfurters |
-0.1% |
+76% |
+39% |
+20% |
+13% |
+14% |
+10% |
+26% |
+16% |
+20% |
+13.7% |
$156M |
|
Processed chicken |
5.1% |
+40% |
+13% |
+14% |
+12% |
+7% |
+4% |
+7% |
+7% |
+17% |
+19.0% |
$41M |
Source: IRI, Integrated Fresh, Total US, MULO, % change vs. YA
Grinds
During December, the dominance of grinds in meat sales continued. Ground beef sales totaled $798 million or 202 million pounds. Ground beef alone added $68.9 million versus year ago levels in December. Altogether, the meat grinds listed below generated an additional $88 million during the December weeks versus $780 thousand for plant-based meat alternatives.
|
% sales change (December 12/6-12/27) versus year ago |
Dollar sales |
Dollar gains |
|
Ground beef |
$798M |
+9.5% |
|
Ground chicken |
$16M |
+25.6% |
|
Ground lamb |
$3M |
+30.3% |
|
Ground plant-based meat alternatives |
$4M |
+21.2% |
|
Ground pork |
$15M |
+10.1% |
|
Ground turkey |
$104M |
+15.3% |
|
Ground veal |
$1M |
-1.1% |
Source: IRI, Integrated Fresh, Total US, MULO, % change vs. YA
What’s Next?
In the latter half of the year, meat department gains have consistently been between 12-15% above year ago levels. The first quarter outlook for 2021 is likely going to continue to be dominated by news and concern over the virus and the vaccine and is likely going to generate similar sales results.
The mid-December shopper survey by IRI found that consumers’ expected length of the health crisis had shortened slightly this month since the vaccine distribution began, however the majority of Americans are braced for the health crisis to last through most of next year.
- 23% expect four to six more months
- 32% expect seven to 12 more months
- 35% expect the health crisis to last over 12 more months (down from 42% in November).
Interest in getting the COVID-19 vaccine grew over the past month, with over half now planning to get it, and more eager to get it as soon as possible. Still, 22% say they will not get it and 23% are not sure yet. Increased interest spanned demographics, with the strongest gains among age 55+ and Hispanics. Shoppers with lower incomes, those without college degrees, and younger Americans showed increases versus last month, but remain less interested than their counterparts.
Source: 210 Analytics
Looking for a reprint of this article?
From high-res PDFs to custom plaques, order your copy today!