Special Report | State of the Industry 2020
The state of the beef industry 2020: adapting to the disruption
This year has been a year of unprecedented challenge for the beef industry as we all adapted to navigate a changed world amid the COVID-19 pandemic. While the year has presented many obstacles, the beef industry has been able to overcome adversity and continues to produce and supply the high-quality protein consumers know and love.
COVID-19 pandemic
State of the Industry 2020
OverviewBeef (NCBA)
Beef (FQF)
Pork
Chicken
Turkey
Veal
Lamb
Seafood
Food Safety
Workforce
Sustainability
Packaging
Watch the 2020 State of the Industry Webinar
Register for free today!
The onset of the pandemic presented immediate and unique challenges for the beef industry as the supply chain was forced to shift product from foodservice to retail almost overnight. Stay-at-home orders left retailers scrambling to keep their meat cases full as consumers began stocking up on beef. Meanwhile, foodservice operators were temporarily shuttered, leaving a surplus of product regularly designated for restaurant kitchens. Even more strain was added to the available beef supply as processors reduced operating capacity at their facilities and temporarily closed some plants to implement updated safety measures and ensure the safety of their workers. Supply-chain disruptions combined with increased demand led to challenging wholesale and retail price increases.
As the pandemic has continued, the industry has shown incredible resilience, rebounding to near normal operating capacity at processing plants and maintaining beef availability at both retail and foodservice as restaurants have begun to reopen. Many economic experts agree that, barring any unforeseen circumstances, the beef industry is likely past the most disruptive period of supply and price challenges.
Beef demand
The good news? Consumers love beef and continue to buy it. Despite the challenges facing the industry and the turmoil through this year, per capita consumption remains strong, with forecasts suggesting a decline of one pound per person, year over year. This slight decrease was caused by nationwide shutdowns prompted by COVID-19, which dramatically decreased beef demand in the foodservice sector and was offset with an increase in retail demand for beef. This gives credence to the resiliency of the industry and exemplifies that consumers continue to choose beef products as their protein of choice, especially when looking for comfort in times of hardship.
ANNUAL BEEF FORECASTS
| 2016 | 2017 | 2018 | 2019 | 2020 | 2021 | |
| Production (million lb.) | 25,221 | 26,187 | 26,872 | 27,155 | 27,048 | 27,355 |
| Per capita disappearance (retail lb.)* | 55.6 | 57.0 | 57.3 | 58.1 | 58.2 | 57.7 |
| Beef & veal exports (million lb.) | 2557 | 2859 | 3160 | 3026 | 2896 | 3140 |
| Beef & veal imports (million lb.) | 3012 | 2993 | 2998 | 3058 | 3272 | 3045 |
Forecasts are in bold. * Per capita meat and egg disappearance data are calculated using the Resident Population Plus Armed Forces Overseas series from the Census Bureau of the Department of Commerce. All data as of Sept 17, 2020. Source: World Agricultural Supply and Demand Estimates and Supporting Materials. For further information, contact: Mildred M. Haley, mhaley@ers.usda.gov
Foodservice
As the U.S. began to respond to the pandemic, the foodservice industry was hardest hit by stay-at-home orders that affected in-person dining and restaurant capacity, and in many cases forced temporary closures. At the bottom of the market, total foodservice transactions were about 45 percent below last year, with full-service restaurants about 80 percent behind. The industry has slowly begun to recover from shutdowns and restrictions, but the impacts will leave a lasting imprint on the foodservice industry.
Retail
With the onset of the pandemic, the retail sector of the beef supply chain experienced a spike in beef demand, which caused sales volume to grow 90 percent from the previous year. As illnesses challenged the processing sector’s ability to operate at full capacity, retailers experienced beef shortages or item outages as a result, causing price spikes of 20 to 40 percent for many beef items, though price levels have since returned to near normal levels. Because of higher prices and demand, total retail meat sales increased $8.3 billion dollars as of August, with beef accounting for $3.8 billion of this increase. Despite recent higher prices, consumers still select beef as their protein of choice.
Stocking up
The increase of beef sales volume was fueled by a major shift in consumer purchasing and stock-up behaviors. While the percentage has slowly started to trend downward, 58 percent of consumers continue to stock up on groceries, with 55 percent specifically stocking up on ground beef and 30 percent on steak. As we move through the pandemic, 57 percent of consumers say they will continue to stock up for the foreseeable future.
JERKY: TOP 10 RETAIL BRANDS
| Brand | Dollar Sales | Dollar Sales % Chg YAgo | Unit Sales | Unit Sales % Chg YAgo |
| Jack Link's | $803,879,346 | 3.3% | 130,839,567 | 0.0% |
| Old Trapper | $219,629,098 | 24.8% | 19,427,418 | 21.5% |
| Private Label | $174,774,829 | 1.1% | 37,538,478 | -2.0% |
| Bridgford Sweet Baby Ray's | $107,403,797 | 8.1% | 22,199,286 | 5.8% |
| Tillamook Country Smoker | $50,387,806 | 3.7% | 8,905,251 | -13.5% |
| Cattleman's Cut | $41,526,419 | 48.9% | 4,729,883 | 58.8% |
| No Man's Land | $31,524,507 | 24.1% | 3,242,965 | 21.7% |
| Oberto | $28,587,074 | -22.2% | 5,193,638 | -22.6% |
| Country Archer | $19,571,383 | 6.2% | 3,096,908 | -1.3% |
| Mingua Beef Jerky | $17,596,826 | 23.7% | 2,353,893 | 21.7% |
| Total Jerky | $1,757,307,036 | 3.3% | 281,745,910 | -1.5% |
| Total Dried Meat Snacks | $3,618,310,755 | 7.2% | 1,062,384,814 | 3.6% |
Source: IRI, a Chicago-based market research firm (@iriworldwide). Total US - Multi Outlet w/ C-Store (Grocery, Drug, Mass Market, Convenience, Military and Select Club & Dollar Retailers), latest 52 weeks ending Sept. 6, 2020. Note: Rankings of top brands are NOT totaled brands (e.g. all brand lines/extensions rolled up into a single figure), but rather individual brand lines.
Given these purchasing trends, more consumers are also cooking at home more frequently, with 84 percent of meals being cooked there. This trend is expected to continue with 66 percent of these consumers planning to continue cooking at home in the future.
Online shopping
Spurred by the pandemic, many shoppers quickly adopted online grocery shopping and meal ordering. In April, 67 percent of consumers purchased groceries online, with 72 percent of them initiating or increasing this behavior as a result of the pandemic. Grocers weren’t the only ones who saw an increase in traffic from online ordering as consumers have also leaned into online meal ordering, with 86 percent of consumers ordering meals currently and 70 percent doing it more often or for the first time because of COVID-19.
OTHER DRIED MEAT SNACKS:
TOP 10 RETAIL BRANDS
| Brand | Dollar Sales | Dollar Sales % Chg YAgo | Unit Sales | Unit Sales % Chg YAgo |
| Slim Jim | $660,537,605 | 10.7% | 320,643,809 | 5.5% |
| Jack Link's | $466,362,565 | 7.4% | 173,326,062 | 4.5% |
| Old Wisconsin | $103,199,458 | 33.8% | 19,112,687 | 25.8% |
| Jack Link's Wild | $71,475,430 | -0.4% | 31,773,203 | -2.6% |
| Duke's | $54,825,757 | 6.7% | 9,937,484 | 2.9% |
| Private Label | $53,377,409 | 40.8% | 17,754,106 | 11.7% |
| Matador by Jack Link's | $44,974,516 | -2.2% | 25,891,286 | 5.7% |
| Tillamook Country Smoker | $35,015,882 | 6.3% | 18,819,219 | -10.7% |
| Penrose Big Mama | $34,190,605 | 5.1% | 18,519,871 | -1.0% |
| Old Trapper | $27,240,866 | 29.4% | 6,399,718 | 0.4% |
| Total All Other Meat Snacks | $1,861,003,719 | 11.2% | 780,638,904 | 5.6% |
Source: IRI, a Chicago-based market research firm (@iriworldwide). Total US - Multi Outlet w/ C-Store (Grocery, Drug, Mass Market, Convenience, Military and Select Club & Dollar Retailers), latest 52 weeks ending Sept. 6, 2020. Note: Rankings of top brands are NOT totaled brands (e.g. all brand lines/extensions rolled up into a single figure), but rather individual brand lines.
Meat substitutes
Despite the ongoing coverage of meat substitutes in the media, consumers haven’t been reaching for plant-based proteins during the pandemic and the proof is in the numbers. While these products have grown in terms of market share year-over-year, they still enjoy less than .5 percent of the protein market, with beef substitutes representing less than 1 percent of beef’s market share. There has been some consumer interest in these products, but research continues to show those trying them still buying beef and not reducing their beef consumption.
Consumer perception
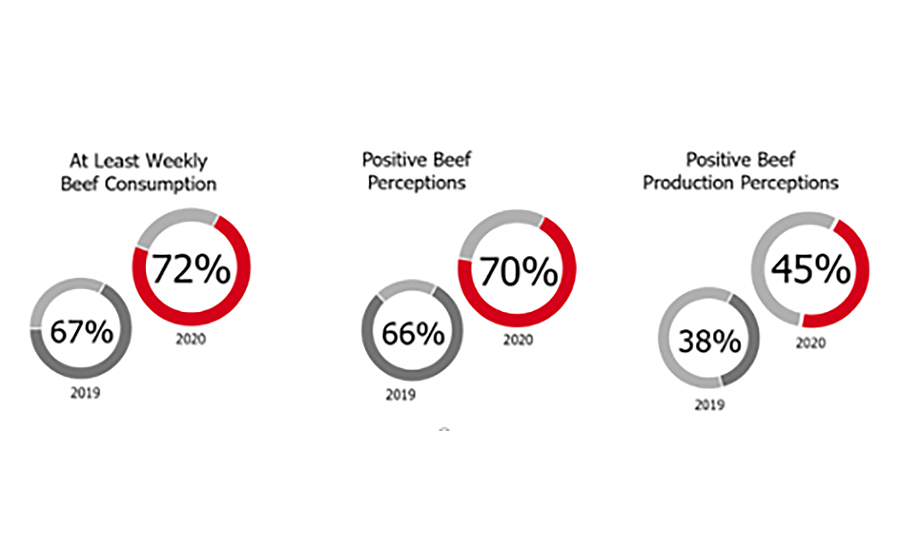
Tracking consumer perceptions in 2020 points to a positive story and great opportunity for beef despite recent challenges. NCBA’s Consumer Beef Tracker data, funded by the Beef Checkoff, allows for continuous tracking of consumer perceptions. From January to July 2020, the percentage of consumers claiming to eat beef at least weekly increased from 67 to 72 percent compared with the same period in 2019. In addition, the number of people with a positive perception of beef increased during this time, resulting in positive perceptions that reached 70 percent for the first time in measurement history. Specifically, positive production perceptions regarding how cattle are raised have increased by 18 percent, compared with 2019. The consumer Beef Tracker data not only provides beneficial insights but confirms the optimistic outlook as the industry moves into 2021. NP
Looking for a reprint of this article?
From high-res PDFs to custom plaques, order your copy today!


